

20 Things I Learned in 2020 (About Investing, That Is)
2020 was an insane year on a lot of levels: the pandemic, the mass unemployment, the impeachment proceedings, the killings on America’s streets, the hubris of law enforcement, the rampant misinformation, the contesting of the election results . . .
But it was an insane year on a personal level for me too. Because when it comes to investing, it featured my biggest loss and my biggest gain. By March 18, I had lost one-third of my money. And then I tripled it. By year’s end I was up 105%.
So I thought it would be a good time to sum up (in completely random order) twenty things I’ve learned in this craziest of years.
1) How to Better Diversify By Using Subsector Classifications
I used to simply buy whatever stocks were the most highly ranked by my Portfolio123 ranking system without regard to what industry they were in. But that caused me to vastly overweight certain industries. Now I set a strict limit: if I have shares in more than a certain number of companies in one subsector, I adjust the number of shares in those companies downward proportionally.
2) How Inventory Changes Can Affect a Company’s Prospects
I hardly paid attention to inventory before 2020. The only use I found for it was in calculating a company’s cash conversion cycle. But I now know that companies that are decreasing their inventory (relative to their total assets) tend to slightly outperform companies whose inventory is unchanging or increasing. I studied this using Portfolio123. If you bought all the companies in the Russell 3000 whose inventory on their latest annual statement is less than what it was on their previous annual statement, you’d have a compound annual growth rate (CAGR) of 12%; but if you’d bought those whose inventory is greater, you’d have a CAGR of only 10%. And if you bought only companies whose inventory decrease is in the top 10% of all companies (relative to their average assets), your CAGR goes up to 13%. Why? There are a number of obvious reasons why reducing inventory is a good thing. You’re reducing excess and obsolete items, which you might eventually have to sell at a discount; you have lower carrying costs; you have less working capital tied up in goods; you’re increasing your cash flow and your efficiency. There are, of course, many instances in which reduction of inventory is a bad sign, but if you include this factor with many others, it might improve your assessment of a company.
3) How to Use Cash Flow to EV in Value Ratios
One of the most useful value metrics I’ve found, and one which I’ve been using for years, is unlevered free cash flow to enterprise value. The formula is pretty simple: take operating cash flow, subtract capital expenditures, add back after-tax interest expense, and then divide by enterprise value. But too often accounting for capital expenditures distorts the picture. Technically, free cash flow should only deduct maintenance capital expenditures, not growth capital expenditures. And there are other items in the cash flow from investing activities that muddy the picture.
There are basically six solutions to this dilemma:
- Subtract the entirety of cash flow from investing activities (if you count capex as a positive number) from operating cash flow. Some financial writers favor this approach, which lumps in acquisitions with capital expenditures, and I personally use it when looking at the ratio of free cash flow to assets.
- Stick with the above formula.
- Try to differentiate (manually) between maintenance and growth capex.
- Instead of deducting capital expenditures, deduct depreciation and amortization.
- Deduct all capex but add back a rough estimate of growth capex (for example, Bruce Greenwald’s formula, which is the five-year average ratio of gross plant to sales times the annual increase in sales).
- Disregard capex altogether and just use operating cash flow (plus after-tax interest expense). This is the one that I’ve just started using in 2020, in addition to the old one, with some positive results.
4) How to Vastly Increase Your Tax-Deductible IRA Contribution
Your annual tax-deductible contribution to an IRA is $6,000, or $7,000 if, like me, you’re over fifty. But in 2020 I was able to contribute more than five times that amount. How? By setting up a Self-Employed 401K. Anyone with some self-employment income can take advantage of this—it doesn’t even have to be a major part of your total income.
With a Self-Employed 401K, you can contribute both as the employee and as the employer. As an employee, you can contribute $19,500. You can contribute an additional $6,000 if you’re over fifty. And then as an employer you can contribute up to 25% of your self-employment income (up to certain limits).
Other than the contribution limits, the self-employed 401K is just like a traditional IRA: the same rules about what you can invest in apply, you have to take RMDs at age 72, and you can rollover other IRAs into it or roll it over into another IRA.
Note that this option works only if you don’t employ anyone else. If you’re self-employed but have other employees, then this account can’t be used.
5) How to Deal With a Value Inversion
The first half or two-thirds of 2020 continued the “value inversion” that we’ve seen in the stock market since, by various accounts, 2010, 2014, or 2017. No matter what the starting date, the 2017 to early 2020 period was extraordinary, as stocks with high price-to-sales and EV-to-EBITDA ratios absolutely crushed stocks with low ratios.
In April I published an article about this. I think my conclusions there are still valid. I deal with the value inversion by balancing simplistic and common value ratios, which have to a large extent been arbitraged, with more unconventional or innovative ones, and heavily weighting my Portfolio123 ranking system with measures of quality, growth, sentiment, and stability.
6) How to Take Into Account SG&A Expenditures When Valuing Companies
If you divide selling, general, and administrative expenditures by market cap, it’s a pretty useful ratio to add to your arsenal of value formulas. For a couple of years I’ve used R&D to market cap, but adding SG&A to market cap as well adds some balance and includes a lot more companies (since R&D expenses don’t apply to a large number of industries). (The SG&A figures I use exclude R&D expenses.)
7) How to Classify Companies Better Than Using GICS
I’ve long had a beef with the Global Industry Classification Standards stewarded by MSCI and S&P Dow Jones. I’ve never understood why Commercial and Professional Services should be included in the Industrials sector, for example. And GICS was designed without considering two important things: the correlation of industry returns and the fact that many companies operate in a number of industries at once.
In 2020, I discovered RBICS, a classification system owned and operated by FactSet. It is, in my opinion, superior in many ways to GICS. The two important things I named above are factors that RBICS takes into account. Companies that operate in several industries are assigned to the primary industry based on the percentage of revenue generated from operations in that industry. RBICS certainly has its share of faults, but after close study of both classification systems, I feel its advantages are quite clear.
8) How to Diminish the Market Impact of Your Trades
Before 2020 I foolishly believed that placing one large order would be cheaper in terms of transaction costs than breaking up your order into little pieces. But the advent of commission-free trades helped me realize I was very wrong. I decided to break up my large orders into smaller ones, thus significantly lessening the market impact of my trades. In addition, I began using conditional orders, which are not placed until the price breaches limits I’ve placed on the bid and/or ask. So the orders are effectively “hidden” until the price reaches a point at which I want to buy or sell. A large order that’s visible on the books at a price above the ask or below the bid will strongly affect that ask or bid for low-volume stocks. Now I avoid that as much as I can.
9) How to Use the VIX to Adjust Your Use of Margin
This year I learned that the CBOE’s VIX index has an extraordinarily high correlation to the future drawdown of the S&P 500. I did a little simple linear regression and came up with the following formula: the maximum future drawdown of the S&P 500 in the short term is probably going to be 0.01*VIX – 0.09 or less. So if the VIX is 30, the expected drawdown is probably 21% or less, if it’s 40, it’s probably 31% or less, and if it’s only 15, it’s probably 6% or less. In my margin account I now calculate how much of a drawdown will result in a margin call, compare that to the VIX-forecast drawdown, and adjust my margin debit accordingly. (Because I invest exclusively in small caps and microcaps, I actually use RVX rather than VIX.)
Here’s my formula. Let m be the market value of your securities; let d be your margin debit (expressed as a negative number, or, if you have no debt, the excess cash you have, expressed as a positive number); let e be the expected drawdown calculated according to VIX or RVX (expressed as a negative percentage); and let x be the drawdown that will result in a margin call (also expressed as a negative percentage). The amount of money you’ll want to put into or take out of securities in your margin account will be:

So, for example, if you have –$200,000 in debt, $700,000 in securities, a permissible drawdown of –30%, and an expected drawdown of –20%, then you can invest an additional $42,424 in securities.
10) How to Tell If a Company Has Too Much Debt
For a long time I’ve been using the debt-to-EBITDA ratio, but I’ve now found that the debt-to-cash-flow ratio is also important to take into account. The formula is simply total debt to operating cash flow. I find these ratios work better than the debt ratio (debt to assets), the current ratio (current assets to current liabilities), or the quick ratio (current assets minus inventory to current liabilities) when I’m trying to avoid overleveraged companies.
11) How Best to Eliminate Outliers When Performing Simple Linear Regression
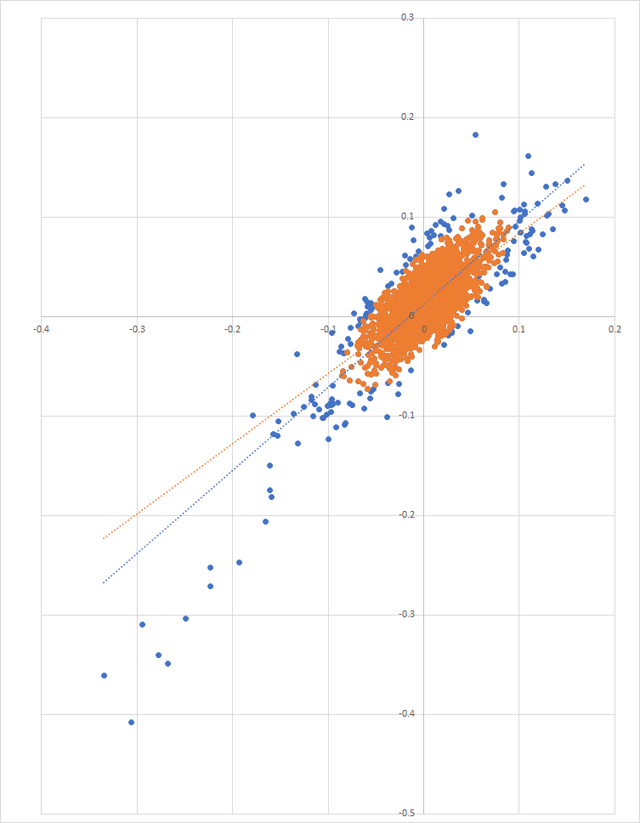
Simple linear regression is the act of estimating a line that will fit a data set with two variables (x and y). I use it most often to find the alpha of a strategy’s past performance. Linear regression is extraordinarily subject to influence by outliers because it relies on the sum of the squares of the distances from the line. The simplest way to eliminate outliers is to take each set of data and trim all values that are in the bottom or top percentiles. But a more complex way may get you better results. If you plot all the data and it’s more or less linear but has a huge blob in the middle (this is always the case if you’re calculating alpha and beta by comparing portfolio returns to that of a benchmark), the best way to eliminate outliers is to draw a confidence ellipse around the central blob and eliminate data points that are outside that ellipse. Here’s how I do this. I calculate the mean and variance of all the x points and y points, as well as the covariance of the two sets of points. Then for each (x, y) point, I calculate

I end up with a number that’s always greater than zero and usually less than 5.
You can then set a sensible limit for how much data to exclude: I usually exclude any data whose number by this formula is greater than 5.3 (approximately one standard deviation), but most people use a higher limit. I’ve found this method gives a “better” version of alpha and beta than linear regression without eliminating outliers, and it’s a lot easier to calculate than using Theil-Sen estimation, which is what I was using last year. Here’s an illustration of this (the orange points are the ones I’ll use for calculating alpha and beta, the blue ones are the outliers I’ll ignore):
12) How to Take Advantage of Consistent EPS Growth
Companies whose EPS grows consistently have a strong advantage over other companies. Here’s what I do. I look at the last six quarters and compare them to the same quarters one year earlier. Then I look at the number of those quarters that are higher, without regards to how much higher. (If you’re a Portfolio123 user, the formula is: LoopSum (“EPSExclXor (Ctr, Qtr) > EPSExclXor (Ctr + 4, Qtr)”, 6, 0).) This tally (which will always be between 0 and 6) measures the consistency of EPS growth. It adds a nice soupçon of excess returns to a ranking system.
13) How to Adjust the Number of Positions in Your Portfolio According to How Much Capital You Employ
Obviously you want to hold a certain number of positions in order to diversify your holdings, but past a certain point (five to ten positions), diversification becomes, in Peter Lynch’s word, diworsification. On the other hand, the larger your holding of a stock, the more market impact you’ll have when you buy and sell it. So as an investor making huge buys and sells in illiquid stocks, I needed to find a formula for a happy medium. Using some regression analysis and some calculus, I realized that maximizing returns means that the number of positions I hold should be proportional to the square root of my total portfolio assets divided by the square root of the median daily dollar volume of the equities I hold. The multiplier I use is 8.6, but that might vary for you, especially depending on how often you buy and sell. For me, if my portfolio is $2.5 million and the median daily dollar volume of my holdings is $125,000, then I want to hold about 38 stocks at a time (8.6*√2,500,000/√125,000). But if my portfolio went down to $1.5 million, then I’d hold only 30 positions.
14) How to Deal With Losing a Third of Your Money
By March 18 this year, I had a 33% drawdown. If I’d been investing in 2008, it would have been even bigger, but I wasn’t. So for me, this was unprecedented. A lot of investors I knew got out of the market earlier, but not me. In fact, at the end of February I’d taken out a huge cash-out refi and put it all in stocks. Now my losses were bigger than the refi. The entirety of my home equity had more or less vanished. And there was no telling when or where this crash would bottom out or how long it would stay at the bottom.
Here was how I dealt with it.
- Don’t talk about it. Keep it as quiet as you can. If you talk about it, someone might convince you to sell. Especially if that someone has a financial stake in the outcome.
- Keep on doing exactly what you’d be doing if the market wasn’t falling at all. Don’t move into any special mode. Stick with your system. Don’t panic and sell. Even if it makes no sense to you to buy stock in a bunch of Canadian mining companies while the market is collapsing, if that’s what your system tells you to do, do it.
- Keep telling yourself that the biggest gains always follow the biggest losses, and that there’s no telling when they’ll happen. Trying to avoid a large loss by divesting yourself of stocks almost always results in missing the biggest gain. In fact, my biggest one-day percentage gain of the entire year (and my second biggest one-day dollar gain) was the day after I hit rock bottom.
15) How to Get Great Fills Every Day
Let’s say you want to buy a stock. Here’s what you do. Put in a small limit order before the open at a price significantly lower than the previous close. When it gets filled, follow up with another limit order at the same price (or at the ask if it’s not much higher). If it doesn’t get filled, modify the order so it’s still below the most recent price; if that doesn’t get filled, near the end of the day modify the order so that it’s at the bid; and if that doesn’t get filled, only then put your limit at the ask. At each point, if your order gets filled, follow up with another order at the same price (or a little higher if the ask is close). If you can place conditional orders, that’s even better: your condition should be that the bid is lower than your limit order.
As the price goes up and down over the course of the day, your initial order will usually be filled at a relatively advantageous time, and you can then follow up with further orders at that time. If you were to place your entire order at once, you wouldn’t get the very best fill if the price went down significantly, since your entire order would have been filled at your limit.
If you want to sell a stock, just do the same thing except substitute higher for lower, ask for bid, and so on.
Before 2020, I didn’t trade this way. Now I get much better fills.
16) How to Use Mean Reversion to Your Advantage
Short-term mean reversion is when the price of a stock that has recently dropped goes back up or one that has recently risen falls back down. This tends to happen more often than not outside of earnings season. But following an earnings announcement, the opposite tends to happen—prices that have risen go up and prices that have fallen keep falling—and that’s called post–earnings announcement drift.
So I wrote a new factor with the following formula: WeeksIntoQ * (Close (0) / Close (20) – Close (0, #Sector) / Close (20, #Sector)). Here’s what it does. It takes the price change over the last four weeks relative to the price change of the sector as a whole and it multiplies that by the number of weeks since the latest announcement. The lower the result, the better. So a stock whose price has fallen by 10% six weeks after its earnings announcement will have a much lower score—and a much higher rank—than a stock whose price has fallen by 10% immediately after its earnings announcement. This factor not only makes me buy stocks that have just had a nice dip without any earnings announcement, it also makes me sell stocks that have had a huge increase in price far beyond their earnings announcement—and those are the kinds of stocks whose next earnings announcements often precipitate a dramatic fall in price.
17) How to Estimate the Intrinsic Value of a Company
I wrote a long article about this recently, and I’ll refer you to that.
18) How to Stop Thinking You Can Do Everything
It’s easy: try to do everything and then look at your sorry-ass results. Case in point: A few years ago, after I experienced a great deal of success in creating a complex algorithm for trading microcaps, I decided to create systems for long-term buy-and-hold investing and for mid-caps and large caps. Fortunately, I put those systems into amber, as it were, creating “live strategies” and designer models on Portfolio123 and choosing buy-and-hold stocks for Portfolio123’s stockpicking competition. Now I see the out-of-sample results of those experiments: they’re all dismal. I came to realize I was not terribly good at large-cap or buy-and-hold investing. I can do microcaps and small caps, but I can’t do everything.
19) How to Gauge a Company’s Volatility
This was also the subject of a long article I wrote. In a nutshell, look at the volatility of the company’s fundamentals, not its price.
The Last Thing I Learned
was not to promise twenty things when I only had nineteen. Sorry I lied in the title of this article.
Happy New Year!