
What Is a Company’s Intrinsic Value? (Pt 1)
This is the first out of three parts of an article about intrinsic valuation.
The Problem with Calculating Intrinsic Value
The calculation of intrinsic value has become a forbidding and abstruse practice. It seems reserved for nerds and members of the Warren Buffett cult. As Aswath Damodaran, one of its most elegant and charismatic practitioners, and perhaps the person who has promoted it more than anyone of late, wrote recently, “uncertainty underlies almost every part of intrinsic value.” Damodaran teaches a terrific semester-long course on the subject, and it’s very clear from even a cursory look at it that calculating intrinsic value is a huge time-suck. Various people have tried to automate the process—most notably Simply Wall St. To their credit they have made their calculation procedure public. One can certainly quibble with a lot of the assumptions and values that go into intrinsic value calculation—not just Simply Wall St’s, but also Damodaran’s and the CFA’s versions—and there are dozens of different approaches. But on the whole, few investors actually practice it, despite paying lip service to it. As Buffett said in 1998, intrinsic value is:
“the present value of the stream of cash that’s going to be generated by any financial asset between now and doomsday. And that’s easy to say and impossible to figure.”
Warren Buffett
Charlie Munger chimed in, in 2007:
“There is no one easy method that could be simply mechanically applied by, say, a computer and make anybody who could punch the buttons rich. By definition, this is going to be a game which you play with multiple techniques and multiple models. . . . We throw almost all decisions into the too hard pile, and we just sift for a few decisions that we can make that are easy. And that’s a comparative process. And if you’re looking for an ability to correctly value all investments at all times, we can’t help you.”
Charlie Munger
Moreover, the conventional methods of estimating intrinsic value simply haven’t worked lately. Underpriced stocks haven’t outperformed basic benchmarks. Aswath Damodaran has, as far as I know, not made millions by investing in stocks whose intrinsic value is far higher than their market value.
If there’s one thing that most intrinsic value procedures have in common, it’s that they’re not evidence-based. Instead they’re based on how accounting and finance should, ideally, work. Ideally, a portion of revenue becomes free cash flow, which is then returned to the shareholder. Ideally, the discount rate one applies depends on a measure of the security’s risk. Ideally, companies have a high-growth stage and then a stable growth stage. And so on.
But practitioners have largely avoided questioning these most basic assumptions and procedures. They’ve avoided actually looking at the evidence and asking the hard questions that result. Is it appropriate to apply the same valuation procedure to Uber (UBER) and Wal-Mart (WMT), as Simply Wall St does? Does valuation have to be so complicated?
What I want to do in this article is to look at intrinsic value from scratch, using actual evidence from today’s markets, and bring some fresh and different ideas to the process.
I’ll warn you in advance, however. My results are not better than Damodaran’s or Simply Wall St’s or Warren Buffet’s. I would never claim that my expertise on this subject is greater than theirs. Damodaran and Buffett are geniuses. I’m a successful fundamentals-based value investor, but when it comes to intrinsic valuation, I’m a dabbler.
Instead, the purpose of this article is to:
- show that intrinsic valuation has some basis in real life and is not just an idle practice for finance nerds;
- try out an evidence-based method which, I hope, can provide some insights into how the market works; and
- present a deliberately naive perspective on intrinsic valuation which might provide present and future practitioners with a few new ideas.
Present Value
The conventional way to think about the intrinsic value of a company’s stock is the present value of future cash flows. This is certainly the way we assign values to bonds. But stocks and bonds are fundamentally different types of investments. A bond has a fixed maturity and a stock does not. A bond is tied to the company’s current performance and a stock is tied to its future performance. A bond pays out its cash flows in the form of interest, but many stocks pay no dividends at all. So the present value of future cash flows may not be the right way to value a company’s stock.
How do we assign a value to a collectible, an artwork, or a bar of gold? We try to figure out how much the object will be worth in a year’s time, or two years, or ten years, and discount that amount back to the present time. But a public company is not a collectible or an artwork or a bar of gold. It is a living, growing entity. And most public companies, if they survive to maturity, eventually produce some sort of shareholder yield in the form of dividends or stock buybacks, while collectibles, artworks, and gold produce none.
Does that mean we can compare pricing a public company to pricing a purebred horse? A horse is a living, growing entity that will produce yield in the form of stud fees and racing winnings. But companies, unlike horses, have no built-in life span. They can survive indefinitely or go broke tomorrow.
No, pricing a public company is unlike pricing anything else. The dividend discount model presents a huge number of problems, but so do all other approaches.
But we ought to be able to arrive at a range of possible prices for a stock. We could, as most do, just trust the market to do it. But wouldn’t it be better to try to figure out how the market is doing it, or what the prices that the market assigns stocks are telling us? Can we simply throw up our hands and say that we have no idea what this company is really worth or whether or not it is fairly priced? If we were to do so, then there would be no justification—besides the market’s extremely opaque estimate—for some companies to be valued at hundreds of billions of dollars while others are valued at only a couple of million.

One way of dealing with this problem is pushing it off into the future. Maybe a company’s present market value depends on an estimation of how much it’ll be worth in ten years’ time. This makes some intuitive sense. The only way Tesla (TSLA) can be valued at twelve times the market cap of Ford (F) is for us to assume that in ten years’ time Tesla will be (by some measurement) twelve times as big as Ford—whether that means twelve times as profitable or generating twelve times the revenue or producing twelve times the number of cars. To some folks that may seem unrealistic, but to the true believers it’s an understatement of the magnitude of Tesla’s future success.
But we can play this game indefinitely. Tesla’s current price reflects the expectation of its success ten years from now, and its price ten years from now will reflect the expectation of its success twenty years from now.
Because future prices, however, must always be discounted to arrive at present value, the value of Tesla a hundred years from now will make very little difference to today’s price, while its value two or three years from now matters a lot. So the discounting of future value to arrive at present value, and using infinity as an endpoint, makes a good deal of sense. If you buy Tesla’s stock today, it doesn’t matter if you plan to sell it in five months or in fifty years. In either case, you still need to take into account its expected growth over an infinite amount of time, because its selling price in five months will also reflect that growth.
Some Formulas
Now let’s get into some very elementary math. And let’s treat stocks like collectibles for a moment.
If t is our time frame and r is our discount rate, the present value of a company equals its “worth” after t years divided by (1 + r)t. But we just said that after t years, its “worth” will be its “worth” after t more years divided by (1 + r)t. Moreover, we don’t know what t is.
The way to take care of this conundrum is to define the net increase in a collectible’s value as its dividend. If a collectible increases by 10% in value every year, it is essentially paying a dividend of 10%.
So whether a stock actually pays dividends or simply increases its market price, it pays its shareholders some sort of dividend for holding those shares.
So let’s say the dividend paid by a company in any given year is dt and its present value is PV. Then
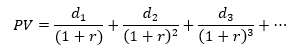
What discount rate should we use? Several approaches have been suggested, including the return of an equally risky investment and the cost of borrowing the capital we’re investing. I’ll have a different suggestion shortly. So let’s table that discussion for a moment.
Instead I want to focus for a moment on the difference between d in two consecutive periods. This could be expressed by g for growth.
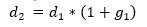
If g were constant for all periods (it’s not), a simple mathematical reduction would result in the following formula:
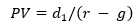
where PV is present value, d1 is next year’s dividend, r is the discount rate, and g is the steady growth rate.
This is called the Gordon Growth Model. As g gets closer to r, PV gets closer to infinity, and if g is greater than r, then one cannot place a value on the company. Why? Because if you look at the series, the value of the company gets larger as time passes faster than the discount rate, so you end up with progressively larger numbers over time.
Now what really happens is that g starts off at one number and then changes. Often, when the company is very mature, g becomes a rather low number.
That way g can start higher than the discount rate but eventually be lower than the discount rate. For example, Tesla might have a growth rate of 40% right now, but once it theoretically dominates the earth, its growth rate might be only about 4%.
The conventional way to handle this is to use a two- or three-stage growth model. The first few years, g is at one level, the next few it’s at another level, and at the end it’s at quite a low level. This gets quite complicated. But it’s quite necessary too.
A Close Look at Growth
Over the last 36 years, the median annual sales growth of a company with stock available to buy in the US is around 9.4%. How does that change as a company ages? I decided to take a look.
First, I narrowed my search to companies that have exactly twenty years of annual statements. Then I took the median growth of those companies over each of the last nineteen years. Then I did this again and again, going back year by year to 2003, which is when I exhausted my coverage. I then took the geometric mean of all those median growth numbers and came up with a relatively smooth curve. This is what you can expect as a company grows from year one to year nineteen:
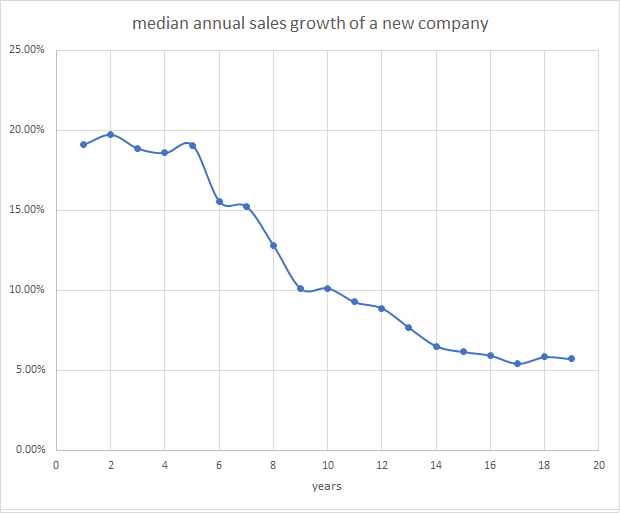
As you can see, a typical company will start with a sales growth of around 19% per year, hold steady at that rate for about five years, then slowly fall to around 6% after fifteen years or so, after which growth will be relatively steady again. This lends itself well to a three-stage growth model. Years 1 through 5 will have an initial growth rate, years 14 through infinity will have a final growth rate, and years 6 through 13 will have a growth rate that steadily drops from the initial to the final growth rate.
(I admit that this study necessarily suffers from survivorship bias. It’s possible that companies that didn’t survive for twenty years might have quite different growth trajectories.)
To Be Continued
In part 2 of this article, I’ll explore how to calculate the discount rate and predict shareholder payout and sales growth.