

Detecting Financial Fraud: A Close Look at the Beneish M-Score
Note: The M Score is used to identify companies that are engaged in manipulating their financials. I am using pseudonyms in this article and changing certain details to mask the identity of the companies in question.
I. Getting Defrauded
Not too long ago, an investment research firm exposed a company I had invested in as a massive fraud. Most of this company’s revenue apparently comes from some other companies that they had recently acquired, but it turned out to be practically impossible to verify that any of that revenue actually existed outside of the company’s books.
Based on their most recent financial statements, I gave this company a very high rating. And I put a lot of money behind it.
This hurt. Not only did it hurt financially—I lost over $80,000—but it hurt my credibility as a quantitative investor. In the big picture, I could stomach the loss. But my investing philosophy is founded on the maxim that safer stocks are better investments than risky ones. And yet I put a large bet on a stock that this research firm would shortly and rightly label an easy-to-spot swindle with fictitious financials.
One reason I was caught off-guard is that this company is listed on the NASDAQ as a US company. Listed stocks domiciled in the US are the safest stocks on earth simply because the SEC is better at going after fraudsters in the US stock market than any other government regulatory body.
Stock market history, though, is full of frauds. It’s in the very nature of the beast. We are taught that we should beware of companies engaging in manipulation of their financial statements. Yet every company, by the very nature of financial reporting, has some leeway in constructing financial statements. There are hundreds of gray areas when reporting financials—which is one reason I frequently say that there is absolutely nothing scientific about financial data. What am I doing when I rank stocks based on this discretionary data, then? Well, I’m dealing in probabilities. If a stock’s reported free cash flow is high, that doesn’t mean that it’s a winner: it means that it’s more likely to be a winner than a stock whose reported free cash flow is extremely low.
So what should have tipped me off that this company was a fraud? Is there something quant-based that I should learn here? Is there a screening rule I can apply to my universes to prevent this from happening again?
II. Messod D. Beneish and “The Detection of Earnings Manipulation”
In 1999, a professor of accounting at Indiana University published “The Detection of Earnings Manipulation” in Financial Analysts Journal. (This was a thorough revision of a method he had first published in 1997.) Messod Beneish was not the first nor the last to attempt to use financial statement analysis to detect fraud. But his method has held up better than any other; in a 2020 follow-up paper, “The Cost of Fraud Prediction Errors,” he proved that his method had a lower ratio of false to true positives than any other method besides a machine-learning-based one introduced in 2020.
Beneish arrived at his formula by examining 74 firms that manipulated earnings over a six-year period and comparing those to 2,332 similar firms that did not. He came up with eight factors whose higher values seemed to indicate a greater chance of manipulation, seven of which compare the latest fiscal year’s figure to the previous one’s. Out of those eight, only five were statistically significant (and one of those five, AQI, still had rather high p-values). Using probit regression, he came up with a formula that included all eight factors, but gave a negative coefficient to two of the statistically insignificant ones and a very low coefficient to the third.
The eight factors are as follows:
- Days Sales in Receivables (DSRI). This compares the ratio of receivables to sales in the most recent fiscal year to the same ratio in the previous fiscal year. The ratio of receivables to sales is basically the percentage of sales for which cash has not yet been received. If that ratio is getting a lot bigger, it’s a sign that the company may be overstating its sales.
- Gross Margin (GMI). This compares the company’s gross margin in the previous fiscal year to the company’s present gross margin. If a company’s gross margin is markedly deteriorating, that gives it a strong incentive to manipulate its financials.
- Asset Quality (AQI). This takes the company’s non-current assets that are not in net plant, property, and equipment, divides that by its total assets, and compares that number to that of the previous fiscal year. If this number is going up, the company may be improperly deferring costs (or it may be engaging in substantial acquisitions; but Beneish notes that “sample manipulators undertake few acquisitions and those are primarily stock-for-stock exchanges accounted for using pooling of interests.”) As he says, “An increase in asset realization risk indicates an increased propensity to capitalize and thus defer costs.”
- Sales Growth (SGI). This is a simple measure of sales growth from the most recent fiscal year to the previous one. High-growth firms are more likely to engage in financial statement fraud.
- Depreciation (DEPI). Beneish measured depreciation by comparing it to the sum of depreciation and net plant. If this ratio is going down, that’s a sign that the company has been revising upwards the estimates of the useful lives of assets, thus increasing the company’s net income through financial manipulation.
- Sales, General, and Administrative Expenses (SGAI). This is the ratio of SG&A to sales. In his original paper, Beneish is rather unclear about why he feels that if this ratio is increasing, it’s a sign of financial manipulation. The only justification he gives is that “analysts would interpret a disproportionate increase in sales as a negative signal about firms future prospects. I expect a positive relation between SGAI and the probability of manipulation.” There’s a contradiction between those two sentences. Later writers have suggested that the factor is justified by the idea that if administrative and marketing efficiency decreases, that could motivate managers to manipulate earnings; similarly, if managers are being paid a lot more, that’s another good signal of financial misdeeds.
- Leverage (LVGI). This compares the ratio of total debt to total assets between the most recent two fiscal years. If debt is rising, there’s more incentive for earnings manipulation, Beneish reasoned.
- Total Accruals to Total Assets (TATA). This ratio does not compare the most recent two fiscal years, but simply takes accruals and divides by total assets. Beneish at first measured accruals using Richard Sloan’s balance-sheet approach, but later (in 2013) switched to a more widely accepted method based on the cash flow statement, which is simply net income less cash from operations.
The calculation of each of these factors is relatively easy. The first seven are simple quotients: if the compared figures are the same from one year to the other, the result is 1; for most of them you take the most recent fiscal year’s number and divide it by the previous year’s and for GMI and DEPI you do the reverse. Accruals are easily calculated as well. Each of the factors are then Winsorized by the 99th and 1st percentile. (For those unfamiliar with Winsorization, that means that any factor above the 99th percentile is given that value rather than its true value; it helps avoid outliers.) Lastly, if elements of AQI, DEPI, or SGAI are N/A, the value is set to 1.
The final M-score (M stands for manipulation) is then calculated using the following formula, based on an unweighted probit regression:
–4.84 + 0.92*DSR + 0.528*GMI + 0.404*AQI + 0.892*SGI + 0.115*DEPI – 0.172*SGAI – 0.372*LVGI + 4.679*TATA.
In his original paper, Beneish admitted that the three factors with low and negative coefficients (DEPI, SGAI, and LVGI) were not proven to be of value. They all have relatively high p-values. While he gave the above probit regression numbers, he did not propose that the M-score be calculated using them. Nonetheless, that is the way it has been calculated ever since, and Beneish has since touted this formula in both his 2013 and 2020 follow-up papers.
The threshold for whether a company is likely to be a manipulator is an M-score of –1.78 or higher, though he allowed plenty of leeway here. If a company’s M-score is below –2 it is unlikely to be manipulating its financials.
There are a lot of online versions of the Beneish M-score, and many of them take slightly different approaches. Portfolio123 uses trailing-twelve-month or, for balance-sheet items, quarterly figures rather than annual ones, and does not Winsorize. YCharts uses annual numbers and does not Winsorize; for AQI they deduct not only noncurrent assets and PPE, but also long-term investments, and for accruals they use operating income rather than net income. There’s an excellent online calculator from Indiana University’s Kelley School of Business, where Beneish teaches, which breaks down any company’s M-score by factor and gives probabilities and odds. It’s faithful to the original calculation, using annual figures and Winsorizing. Other calculations can be found from GuruFocus, FinBox, MacroAxis, and so on. Seeking Alpha does not offer the M-score—yet.
III. Digging into the M-score
I’m going to look a little more closely at how the M-score functions in practicality, examining each of its factors.
I recently looked at the M-scores and the eight factors for about forty companies that have received damning reports from an investment research firm that specializes in accounting irregularities, undisclosed related-party transactions, and illegal financial reporting practices. Not all of those companies engaged in financial manipulation, but a majority of them seem to have. The conclusions I arrive at below are informed by my examination of those reports.
As concrete examples, I’m going to be looking at five companies. The first four manipulated their financial statements, while the last doesn’t seem suspect in the least. I’m identifying all of them besides Enron using pseudonyms and changing almost all of the details about them, including dates; but the financials I’m giving are not fictional. The companies are:
- The Argonarm Group, which is the company I lost money on. At the time the report came out identifying it as an obvious fraud, the M-score identified it as a possible manipulator. It identified it as a likely manipulator prior to that, but that was before it had acquired the other companies, so it wasn’t really on anybody’s radar.
- Miracle Prospect Machinery. This company was taken over nearly a decade ago by a man who was wanted abroad for running a ponzi scheme and for forgery. A year later, the company pivoted into a new business segment and entered into a joint venture with a firm whose VP was this man’s wife; that firm was then investigated by the SEC, and most of its software contracts did not exist. I’ll be looking at Miracle’s financials, before its stock price collapsed. The M-score identified this company as a safe one.
- Neapolis Charter Tools. The SEC hit this company with subpoenas several years ago and again two years later. Neapolis admitted “weakness” related to its financials, and restated some of them as a result. The company had a long history of questionable business practices; I lost a lot of money on it myself. I’ll be looking at its financials between the year of the original subpoena and the second one. The M-score correctly identified this company as having a high probability of earnings manipulation.
- Enron. Problems with Enron’s financials were beginning to be seen in late 2000, but it wasn’t until October 2001 that they were out in the open. That was when Enron announced that restatements to the last four annual reports (those of 1997 through 2000) were necessary to correct accounting violations. The following month they filed documents with the SEC revising those statements to account for losses of $586 million. Using an earlier version of Beneish’s M-score, Cornell University students identified Enron as having a high probability of earnings manipulation way back in 1998, based on its annual report covering 1997. But if one applies the M-score to the annual reports covering fiscal years 1998 or 1999, it indicates that the company is a safe one; all the while, Enron was moving its operating losses to special purpose entities. The 2000 annual report, issued in 2001, was a different kettle of fish: the M-score rose to –0.55, and people were growing extremely skeptical of what was in those reports. But by that time, the stock had begun its descent. I’ll be looking at the Enron M-scores as of mid-2000 and mid-2001.
- Rebria Services. There is absolutely no evidence of any fraudulent practices or earnings manipulation at Rebria, and nobody seems to have even suggested any such thing. I’ll be looking at its current financials. The M-score identifies this company as having a high probability of earnings manipulation, solely because its DSRI is extremely high (due to the sale of the commercialization rights to one of its technologies to another company).
The chart below gives each of the Beneish M-score factors for these five companies using Compustat data from Portfolio123, with the Winsorization points gleaned from the Kelley School website. I have two lines for Enron for different dates.
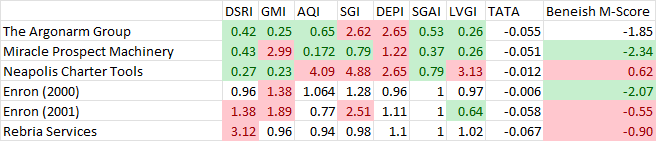
For the factors, red shading indicates high scores (above the 90th percentile) and green shading indicates low scores (below the 10th percentile); no shading indicates normal scores (between the 10th and 90th percentiles). For the M-score, red is given to companies above –1.78 (“likely manipulator,” according to the Kelley School website), green to companies below –2 (“not manipulator”), and no shading to companies between (“possible manipulator”).
One of the striking things about this chart is that the three recent companies that have committed earnings manipulations have extreme scores (very high or very low) in most categories. Let’s go through the factors one by one and see if we can explain that.
- DSRI. If a company has a low score, it means it’s decreasing its receivables compared to sales. That may be a good thing, but it could also be a sign that the company is desperately offering extended credit terms to customers, making sales to customers with weak creditworthiness, channel stuffing (shipping excess inventory to distributors or retailers without demand), or—and this is the prevalent point for the companies I’ve been looking at—recognizing revenue prematurely. In my research I’ve found that companies with very high or very low DSRI scores are suspicious. Argonarm, Miracle, and Neapolis all had abnormally low DSRI scores. Rebria, on the other hand, had an abnormally high DSRI score, greater than the 99th percentile, because of the sale of the commercialization rights to one of its technologies, so it was Winsorized to 3.12.
- GMI. If a company’s gross margins are wildly increasing—as is the case with Argonarm, whose margins improbably went from 16% to 68%—that’s plenty of cause for concern. One of the things that alerted the research firm to Argonarm’s fraud was its insane margins, which were far higher than that of any other company in its industry. Neapolis also reported an extreme increase in its gross margin, as did a number of the other companies that I examined.
- AQI. This factor depends on the balance between three things: current assets, net plant, and total assets. If one or two of those change radically from one year to the next, that can be a significant warning sign. Let’s look specifically at Miracle, for example. Their 2013 balance sheet listed only $0.1M in cash and $1.9M in current assets, almost all of which was in receivables. They also had $3M in deposits, so their total assets were $5.7M. In 2014, however, their total assets had grown almost ten times to $53M because they had reportedly increased their cash to $45M. Their PPE remained about the same (from $0.5M to $0.7M). That’s why they received such an absurdly low AQI. Something similar was happening with Argonarm: their cash ballooned from $97M to $500M, their net plant went from $0.7M to $855M, and their total assets grew almost ten-fold, from $177M to $1.68B. Reverse mergers and acquisitions notwithstanding, this kind of thing merits close consideration.
- SGI. Extremely high reported sales growth is indeed the number-one flag for revenue falsification. Beneish was right on target here.
- DEPI. Once again, Beneish was on the nose. Argonarm, Miracle, and Neapolis scored very high on this measure. But it’s important to point out that two things can make this ratio work: one is an extreme decrease in depreciation; the other is an extreme increase in net plant. In the case of these three companies, it appears that their new assets either had a much longer useful life or a much lower cost than their old ones did. The likelihood of that does not seem terribly high.
- SGAI. A huge increase in sales without a corresponding increase in SG&A is a clear warning sign that sales may be overstated, so a low SGAI may be just as bad as a high SGAI. This is actually what Beneish’s original language in the 1999 paper suggested, and corresponds with the negative coefficient given to this factor. In my research on suspect companies, a large number of them had either extremely low or extremely high SGAI scores.
- LVGI. Beneish supposed that an increase in debt would be a sign of manipulation, but it’s actually the reverse. Companies that are decreasing their ratio of debts to assets might be paying off their debts, but they might also be increasing their equity by selling lots of shares. That’s certainly what Argonarm did: its ratio of debt to assets went down to 9% of what it had been the year before! One of the most prevalent signs of a company engaging in fraudulent activities is that they sell shares. Argonarm wasn’t the only company that did so: so did Miracle and Enron. That’s what makes the fraud pay off!
- TATA. Coincidentally, all five of the companies in question here have moderate accruals. In my limited research, I didn’t actually find that much of a correspondence between high accruals and a propensity for financial malfeasance. But I trust Beneish on this: he looked at a lot more companies than I did.
IV. Revising the M-score
I have a few minor quibbles with the M-score, so I took it upon myself to make some changes to it, to wit:
- Averaging. I found the M-score varied wildly from year to year. Each annual statement gave a different picture. I also worried that the M-score wasn’t current. If Argonarm’s “coup”—its acquisition of several kindred companies in the same quarter—had happened between annual reports, its M-score wouldn’t have changed. (In this case, that would have been a good thing, as the previous year’s annual report earned an extremely high M-score of 0.21.) At any rate, I thought it would be better for each factor to average the comparison of this year to last year with a comparison of the current quarter to the same one last year and, for non-balance-sheet items, the trailing twelve-month values with those of a year ago.
- N/As. Beneish gave values of 1 to three factors if information wasn’t available; I did the same with the other four year-to-year factors, and gave a value of -0.05 if TATA was N/A. This improves coverage, and allows us to include financial stocks (which Beneish excluded), to many of which items like gross margins or current assets don’t apply. In order to best protect oneself from fraud, it’s good to have a number for all companies.
- Winsorizing. Beneish winsorized at 1% and 99%. That allows one factor to completely dominate, as we saw with Rebria. I think it’s better to Winsorize at 5% and 95%.
- Bidirectionality. For four of the factors I thought it would be better to give high scores to both huge increases and huge decreases. Those are DSRI, GMI, AQI, and SGAI. To calculate these, I first took the averages, then Winsorized them; after that, if the result was less than one, I used its reciprocal instead.
- Leverage. I found a slight problem with the way Beneish used this factor. Let’s say a company increased its debt load by 700%. Because of Winsorization, it would get a score of 3.13 (a company that keeps its debt the same gets a score of 1). LVGI has a coefficient of –0.327. So a company that significantly increased its debt would see its M-score go down by (3.13 – 1) x 0.327, or 0.7, making it a much safer bet. That didn’t make sense to me. So I use the reciprocal of the leverage factor (i.e. last year’s debt to assets divided by this year’s) and give it a positive coefficient. Now a company that increases its debt load by 700% gets a score of 0.33, which makes its M-score go down by only (1 – 0.33) x 0.327, or 0.22. As for a company that radically increases its equity by selling a huge number of shares, Argonarm’s debt-to-assets ratio went down by 74% (its value is 0.26). So reversing it gives it a score of 3.85, which would then get Winsorized to 2.63. That raises its M-score by 0.53, which seems more appropriate than having its M-score raised by only 0.24.
- Share Increase. I added one additional factor, called share increase index (SII), modeled on Beneish’s factors, that compares the fully diluted share count for this year (and the most recent quarter) to that of the previous year (and the same quarter last year). I noticed that a lot of these fraudulent companies issue a lot of new shares or issue additional treasury shares or sell convertible preferreds to make money before they’re caught. And they weren’t always the same companies as those with low LVGI scores, since many of them both issued shares and increased their debt load.
- Coefficients. Because I changed the way four of these factors worked, I had to change their coefficients too, which I did by comparing the new range (10th percentile to 90th) of the factors to the old range. I gave my new factor (SII) a coefficient that was a range-adjusted average of the eight existing factors; I also changed the two factors with negative coefficients to positive ones due to the way I changed those factors. In the end, I altered five of Beneish’s coefficients somewhat, but kept three of them the same (SGI, DEPI, and TATA).
- Intercept and Cutoff. Beneish’s formula had an intercept that seemed arbitrary. It’s a bit confusing for novices to have to deal with the fact that most but not all Beneish M-scores are negative. I think that an M-score of zero means that the probability that the company is a manipulator is 50%, but I’m not sure. At any rate, I changed my intercept so that a company with all N/A values would get a score of zero. Some companies still get negative scores, but most of them get positive ones. Since approximately 8.25% of listed companies with reasonable liquidity get a Beneish M-score greater than –1.78, I used the same percentile to come up with a cut-off score of 1.83.
My final formula is as follows:
–5.384 + 1.312*DSRI + 0.585*GMI + 0.663*AQI + 0.892*SGI + 0.115*DEPI + 0.255*SGAI + 4.679*TATA + 0.288*LVGI + 1.508*SII
where the various formulas are altered as described above.
I have not been able to backtest my formula to see whether it works better than Beneish’s in general. Beneish had access to a well-defined dataset of companies that had definitely manipulated their financials. I do not. I was able to backtest it to see whether imposing limits based on the revised M-score improved returns when used in conjunction with a ranking system to pick stocks. The results were mixed: most backtests improved, but a few did not. Using it, my own returns would have been better and I would have avoided buying Argonarm.
Perhaps my formula is not an improvement on Beneish’s. Certainly it’s much more difficult to calculate, requiring inputs from eight quarterly reports rather than two annual ones, and some more complex calculations with a few of his factors.
Here are the revised scores for the five companies I examined earlier. Note that due to the changes I made, DSRI, GMI, AQI, and SGAI never go below 1.

My revised formula does perform better than the original one for three out of these five companies (Argonarm, Miracle, and Rebria) but worse for Enron and about the same for Neapolis. There’s selection bias at work here too: I chose these companies to illustrate my points.
I have made a public screen on Portfolio123 so that you can see exactly how all of the factors for both the Beneish M-score and the revised version are calculated; you can also input tickers to see their scores.
V. How to Use the M-score
There are two options that seem logical to me. The first is to simply subject companies with high M-scores to further scrutiny on a case-by-case, discretionary basis. The second is to simply exclude companies whose M-score is high.
Some of the companies I’m invested in have quite high M-scores too (both Beneish and revised). I may reconsider those investments. On the other hand, it’s comforting that two of the companies I’ve taken a strong position against (by buying puts) also have very high M-scores.
There is no simple method for catching financial fraud, just as there is no simple method for picking winning stocks. However, paying attention to certain signs of fraud would have helped me avoid the Argonarm fiasco. I hope that using the M-score will help me—and you—avoid others in the future.