

Why Low-Variability Investing Works
It has long been established that stocks with low variability in prices tend to outperform stocks with high variability. I’ve explored this in a few recent articles (A Tale Of Two Volatilities, Low-Volatility Stock Picking For High-Volatility Markets, and Why Alpha Works – And A New Way Of Calculating It), and the evidence for outperformance is strong. But the explanations for this outperformance given in academic articles have, so far, been lacking.
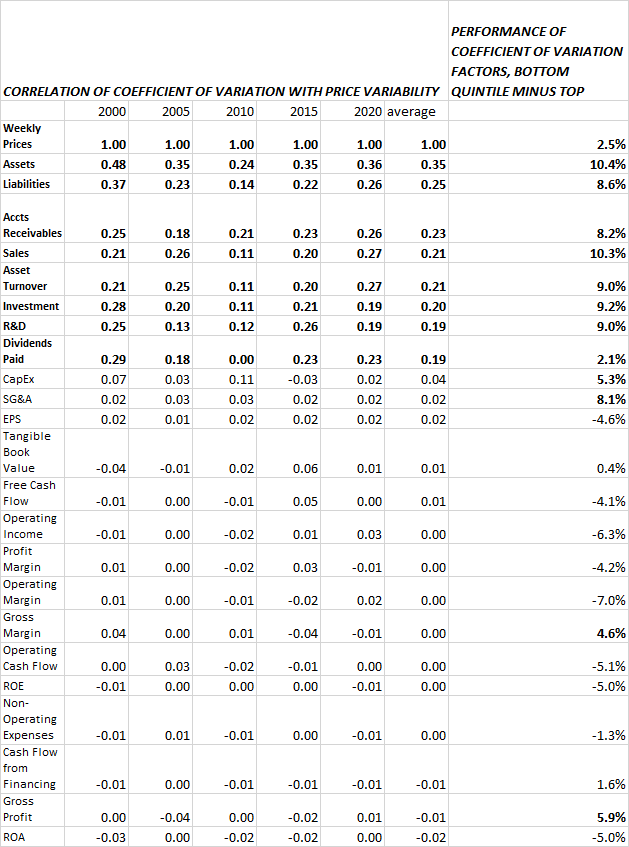
Thanks to the suggestions of some of my readers (especially Marc Gerstein and Hans Koolschijn), I decided to look into whether variability in fundamentals correlates with variability in prices, and if so, whether that variability also inversely correlates with performance. The consistency of my findings, which I present in the table below, astonished me.
The coefficient of variation is the standard deviation divided by the mean. So the coefficient of variation of a stock’s weekly prices over the last three years is simply the standard deviation of those prices divided by the average price. Similarly, the coefficient of variation of a company’s assets over the last three years is the standard deviation of the total assets of the company over the last twelve quarters divided by the average assets over the same period. A company whose assets have changed dramatically from quarter to quarter will show a much higher coefficient of variation than a company whose asset base is stable. Thus, when it comes to assets, FiServ (FISV) has a coefficient of variation of 1.16 over the last three years because its assets have varied so greatly while Regency Centers (REG) has a coefficient of variation of 0.01 because its assets have stayed almost exactly the same.
Using Portfolio123, I took the Russell 3000 and measured the quarterly coefficient of variation of twenty-three fundamental items over the last three years. I then calculated the correlation between that coefficient and the coefficient of variation of weekly prices for those stocks over the same time period. The correlations for fifteen of those items were so low as to be nonexistent. But the correlations for eight of them were quite high. I repeated this experiment five times in all, for three-year periods ending in 2020, 2015, 2010, 2005, and 2000. In each case I got more or less the same results.
Companies with high quarterly variability in assets, liabilities, sales, accounts receivables, asset turnover, total investment (gross plant plus inventory), R&D expenditures, or dividends paid tend to have high variability in prices. On the other hand, companies with high variability in income, cash flow, margins, or profitability show no more nor less variability in prices than companies with low variability in those things.
I then measured what would have happened if you had taken stocks in the Russell 3000 and divided them up into quintiles based on the coefficient of variation of each of these factors, rebalancing monthly since January 1999. Companies with low variability in those factors that correlate with variability in prices tend to massively outperform companies with high variability, with the exception of dividends paid, where the outperformance is more modest. (In addition, companies with low variability in SG&A expenses, gross profit, capital expenditures, and gross margin also strongly outperformed.) On the other hand, companies with high variability in income and cash flow outperformed those with low variability, as did companies with high variability in ratios (profitability and margin) based on income and cash flow.
The explanation for the performance here is relatively simple. Investors prefer companies whose income and cash flow are growing (thus exhibiting variability). But they also like companies with stable fundamentals. The ideal company for an investor is one whose earnings and cash flow are growing while everything else remains more or less the same. (Investors love to give lip service to companies with large growth in sales. But they don’t put their money where their mouth is. The performance of stocks ranked by decile on sales growth looks like a bell curve, with the highest performance smack in the middle and the lowest performance on the tippy ends. This is the case no matter how far back you go in time, as James O’Shaughnessy made clear in What Works on Wall Street.)
The explanation for the correlations is similar. Companies with stable fundamentals have stable prices. Price variability serves as a proxy for variability in fundamentals. Importantly, it reflects only the variability in certain fundamentals, variability which correlates negatively with price performance.
So a much more profitable strategy than investing in stocks with low variability in prices is to invest in stocks with low variability in fundamentals, as long as those fundamentals don’t include income, cash flow, or ratios based on those.
Below is the performance of going long the bottom quintile of stocks in price variability in the Russell 3000 and shorting the top quintile between January 1999 and today, with monthly rebalancing. You can see that this strategy works well in bull markets and badly in bear markets.

I’ve created a ranking system, which you can view here. It equally weights variability in assets, liabilities, receivables, sales, investments, and R&D expenditures. Here’s the bottom-minus-top quintile performance of that system:
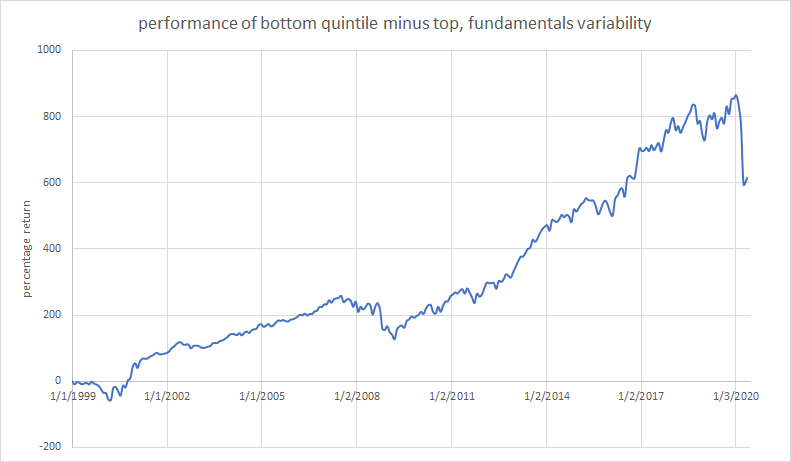
This system, as you can see, doesn’t suffer as much during bear markets and makes three or four times the return. It also handily beats the S&P 500, which returned only 250% during this time period. Its CAGR is 8.87%, compared to 5.99% for the S&P 500. (The system also works very well using S&P 500 stocks, but the total return is 351% rather than 614% when using the Russell 3000.) Not many long/short strategies outperformed the S&P 500 over the last two decades.
On the other hand, this is just a backtest. Was there any way to know, back in 1999, that low variability in non-income-related fundamentals would be a ticket to high returns? Not only that, but it would be very hard to short some of the tiny biopharmaceuticals in the top quintile.
And the system’s outperformance really comes from the short side. The bottom seven deciles have slightly above average returns, but the stocks in the top decile—those with the most variability, those you’d want to short—lose 5% a year (this is the compounded figure, not the average).
In short, this is not a complete investment system, and I wouldn’t advise anyone to use low variability as their sole investment criterion. But if you’re interested in a low-volatility portfolio that outperforms, I’d advise you to look at stocks with low variability in fundamentals rather than low variability in prices; and if you’re interested in hedging, shorting a widely diversified portfolio of stocks with high variability in fundamentals is not a bad choice at all. Lastly, if you use a multi-factor system for stock investing, as I do, low variability in fundamentals should be a part of your factor arsenal.
2 Replies to “Why Low-Variability Investing Works”