

Waiting for Fair Value
The idea behind value investing is that you buy a stock well below its fair value, wait for it to appreciate to something close to its fair value, and then sell it.
The natural questions, then, are:
- How long does this process take?
- How often does it actually happen?
- Why does it happen?
Is it possible that this whole idea doesn’t actually work? Is it possible that if you buy a stock well under its fair value you have no better chance of it reaching fair value than if you assigned a more or less random price target to a random stock and held it until it reached that target?
I decided to study stocks listed on the major US exchanges over the last 22 years to try to get an answer to these questions. To be honest, at the outset of my study I had no idea what the answer would be.
Assigning a Fair Value to a Stock
As I’ve written, calculating an intrinsic value for a stock is a process fraught with difficulties, and I believe it cannot be done using an algorithm. It is a necessarily discretionary process. The most recent attempt I made at an algorithmic method relied on backtests I’ve done on the last twenty years of data, so that algorithm cannot be properly tested on that same data.
Instead, I’ve come up with a formula that assigns a fair value to a company based on comparing seven measures to those of the average comparable company: its sales, income, shareholder payout, tangible book value, research expenditures, EBITDA, and unlevered free cash flow.
Methodology
Here is my methodology. It gets a bit technical, so you can skip it if you’d like.
I start by using Portfolio123 to come up with aggregate ratios for each item. I’ll give an example with net income. I look at the current fiscal year’s mean EPS estimate for each company in a GICS subsector and multiply it by the number of fully diluted shares; if a stock has no EPS estimate, I’ll use its trailing-twelve-month net income instead. I then divide it by its market cap. I then exclude the top and bottom 16.5% of the results and all zero or negative results. I take a cap-weighted average of the rest. I’ll call this the aggregate subsector earnings yield.
Then I take the company’s estimated income (or actual income if there’s no estimate) and divide it by the aggregate subsector earnings yield for its subsector to arrive at what I’ll call an income-based fair value.
For example, let’s take a large cap stock which I’ve selected randomly, Newmont (NEM). It has an estimated net income of $3.05 billion this fiscal year, according to analysts. The earnings yield of its subsector (which in this case is the same as its sector, materials) is 5.6%. Divide $3.05 billion by 5.6% and you get an income-based fair value of $54.5 billion, which isn’t that far from its market cap ($45.4 billion).
I do the same thing for the company’s sales. For the shareholder yield, I follow a similar course, using total equity purchased minus total equity issued plus total dividends paid, multiplying the latter by the indicated annual dividend divided by the dividend per share of the most recent fiscal year (all numbers here are for the most recent fiscal year). For the tangible book value, I simply use that item based on the most recent quarter’s balance sheet, without relying on estimates. For the research-based fair value, I simply make that zero if the aggregate for the subsector is zero.
For EBITDA and unlevered cash flow, I also privilege estimates, but divide by enterprise value rather than market cap and use the entire universe of non-OTC stocks rather than the subsector to calculate the aggregate; I then subtract from the result the company’s total debt, noncontrolling interest, and preferred equity, and add its cash and equivalents, to get back to its market-cap based fair value.
I end up with seven factor-based fair values. I exclude the highest and lowest of these and average the middle five to come up with my final fair value.
But for companies in the financial sector, I don’t use the EBITDA, unlevered free cash flow, or research values, and I take the median of the other four.
Fair Value Examples
Here are some examples of fair values for a dozen S&P 500 stocks, chosen completely at random:
| Ticker | Name | Fair Value | Market Cap |
|---|---|---|---|
| CSX | CSX Corp | $ 54,746 | $ 70,221 |
| AJG | Arthur J. Gallagher & Co. | $ 8,260 | $ 23,279 |
| WU | Western Union Co | $ 22,009 | $ 9,832 |
| NUE | Nucor Corp | $ 25,830 | $ 17,524 |
| MTB | M&T Bank Corp | $ 19,888 | $ 19,246 |
| BLK | Blackrock Inc | $ 62,090 | $ 108,315 |
| ALXN | Alexion Pharmaceuticals Inc | $ 37,778 | $ 34,134 |
| FISV | Fiserv Inc. | $ 72,371 | $ 74,645 |
| WFC | Wells Fargo & Co | $ 216,189 | $ 156,768 |
| COF | Capital One Financial Corp. | $ 137,015 | $ 54,878 |
| COG | Cabot Oil & Gas Corp | $ 3,919 | $ 7,398 |
| JPM | JPMorgan Chase & Co | $ 404,200 | $ 451,372 |
As you can see, most of these companies are relatively fairly valued at the moment. Western Union and Capital One seem underpriced and might be good value-based investments; Arthur J. Gallagher seems comparatively overpriced.
Please note that I did no backtesting at all to come up with this complicated formula. The seven measures I chose are all old, dating from the 1980s or earlier; it has long been standard to compare market-cap-based value measures to similar companies, and it has long been standard to compare EV-based measures to the market as a whole.
Now let’s see how investing in underpriced companies and holding until they are fairly priced actually works in practice.
Testing a Fair Value-Based Strategy
My test is to check every week among all stocks listed on US exchanges and to buy them if a) their market cap is $30 million or more; b) their price is $1.00 or more; and c) their fair value is three times their market cap or more. I will then hold them through thick and thin until their market cap becomes greater than their fair value—or until they’re delisted or are bought by another company.
I tested this going back to 1999 using Compustat’s database, building a portfolio that at its peak numbered over 400 stocks. The CAGR of the equity portion of the portfolio (ignoring the cash portion) is 15.77%, which is respectable, considering the CAGR of the S&P 500 is 7.28% over the same period, and considering that you’d often be holding almost as many stocks at a time. A total of 3,118 stocks were bought. 53% of the stocks were winners. The average return of a stock was 36.98%; the average holding period was 464 days (about 15 months). Here is a year-by-year summary:
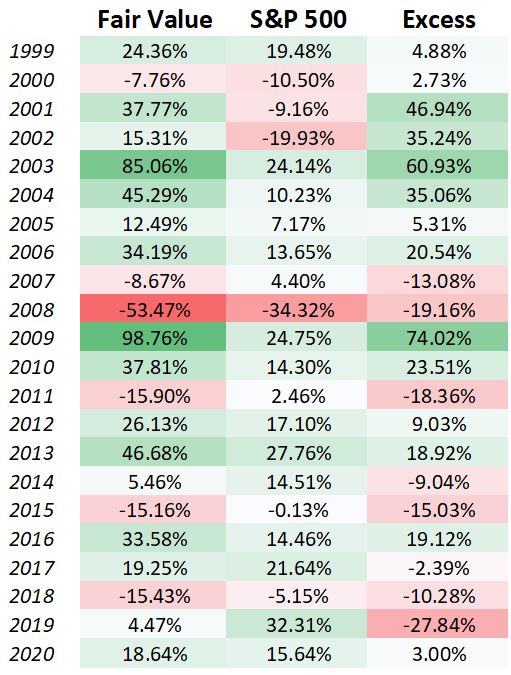
As one would expect of a strictly value-based strategy, it outperformed over the 21st century as a whole, but underperformed the S&P 500 in six out of the last ten calendar years.
Now some of these stocks rose to their fair value; others were sold because they were delisted or acquired. To answer the first two questions I posed at the beginning of this article:
- Of the 2,356 stocks that were bought more than five years ago, 78.7% of them “rose” to their fair value within five years; 20.5% were delisted or acquired; and 0.8% remained in the portfolio for over five years. (I put “rose” in quotation marks because in many cases the fair value dropped so much that the stock was sold at a loss.)
- Of all the stocks that “rose” to their fair value within five years (and this includes some stocks bought in the last five years), it took an average of 370 days for them to do so, which is just over a year; they had an average return of 34.13%.
We can conclude that the average stock, if bought at a discount of 67% to its fair value, will take about a year to “rise” to its fair value.
It’s important to note that this system buys each stock at more or less the precise moment when its price dips below 1/3 of its fair value. Its price could continue to fall for a while afterwards. It sells it at more or less the precise moment when its price reaches its fair value. Its price could continue to rise afterwards.
The Mean Regression Puzzle
Now it’s entirely possible that what we saw with fair value is simple mean regression. By this I mean that as long as one can come up with a “fair value” for a stock that is based on an average of some kind, then, by the strict and immutable laws of probability, stocks that are very cheap or very expensive compared to the average will be more likely to have average prices later. This has nothing to do with how much a stock is actually worth.
If, on the other hand, our measure of “fair value” is a good indication of how much a stock is worth, then a measure of “fair value” that is simply based on mean regression would produce a distinctly worse outcome.
The Fundamental Difference
So here’s how I came up with a mean-regression-based model.
Most fundamentals of a company are positively correlated with its market value. The reason the seven components of my fair value have been chosen by value investors over the years is not just that they’re correlated with market value but that they also make a positive contribution to it. If, for example, one had chosen total liabilities instead of book value, or cost of goods sold instead of R&D, one would have favored companies that are likely to do poorly rather than companies that are likely to do well.
One can classify fundamentals into roughly four groups:
- Positive fundamentals. These are the seven fundamentals I chose to base fair value on (income, sales, EBITDA, free cash flow, R&D, shareholder payout, and tangible book value): when a company’s positive fundamentals go up, it’s taken as a good sign.
- Negative fundamentals. These are things like cost of goods, liabilities, debt, and inventory: when a company reduces its negative fundamentals, that’s taken as a good sign, and if you compare two companies with the same market cap, you might favor the company that reports lower figures for these items.
- Neutral fundamentals. These are things like total assets, number of employees, SG&A expenditures, PP&E, depreciation and amortization, and so on. All of these correlate roughly with a company’s market cap but they are not normally used for valuation purposes; decreases or increases in these fundamentals are not necessarily good or bad, and if two companies with the same market cap had different levels of one or more of these items, it would not be considered a bullish or bearish sign.
- Uncorrelated fundamentals. In this category would be all ratios, since ratios have no correlation with market cap; also included would be items that only appear sporadically on a company’s statements and items that vary wildly from company to company or from statement to statement.
In order to determine if value really is a significant improvement on mean regression, I have come up with a measure that we can use as a base rate: a fair value measure that is based on neutral fundamentals rather than positive ones. We’ll call it, for the sake of jest, the company’s “unfair value.” Like the fair value measure, it has seven components: total assets, number of employees, SG&A expenditures, gross PP&E, depreciation and amortization, working capital, and intangibles. I’ll compare total assets and working capital to enterprise value and the rest to market cap, using exactly the same sorts of calculations as I made for the seven components of the fair value estimate (for firms in the financial sector, I’ll use only assets to market cap, employees, and SG&A). Please remember that these are ratios that, as far as I know, nobody actually uses because they make little financial sense. Once again, I’ll buy companies at one-third of their unfair value and sell them when they reach their unfair value.
The “unfair value” should be taken as a base rate to which to compare the results of the “fair value” experiment.
Price-Based Value
Just to be on the safe side, I’ve also created a “price-based fair value” that has nothing to do with a company’s fundamentals.
I’ll set the “price-based fair value” of a stock as equal to the average of its price one month ago, three years ago, and five years ago, each adjusted for the growth of the sector it’s in since then. (I’m avoiding its price six months ago and one year ago because of the momentum factor.) Once again, we’ll buy stocks that are priced at one-third of their price-based fair value and sell them when their price is greater than their price-based fair value. This system disregards fundamentals altogether, simply buying stocks whose prices have fallen quite drastically.
Base Rate Results
If the success of the “fair value” measure were due entirely to mean regression, we should find the same success with the “unfair value” measure and the “price-based value” measure. But we do not. Below is a table comparing the results.
| Portfolio CAGR, 1999-2021 | Portfolio CAGR, last 10 years | Average Holding Period | Average Return per Stock, Annualized | %age of Stocks that Rose to Fair Value Within 5 Years | |
|---|---|---|---|---|---|
| Fair Value | 15.77% | 14.14% | 464 days | 28.09% | 78.70% |
| Unfair Value | 12.94% | 13.48% | 1,094 days | 12.50% | 38.40% |
| Price-Based Value | 8.62% | 13.62% | 646 days | 19.89% | 63.76% |
On every measure—CAGR, average holding period, return per stock, and percentage of stocks that rise to fair value—the original “fair value” method works far better than the “unfair value” or the “price-based value” method.
Conclusion
Value-based investing works. If you buy a stock at a deep discount to its fair value with a plan to sell it when its market value is more or less equal to its fair value, you will more likely than not end up realizing a decent profit. And your success will not be due solely to the law of mean regression. Stocks actually do have a fair value, no matter how difficult it might be to come up with a reasonable estimate of it. I won’t say that value investing is the only method that works in the stock market. But as a portfolio management strategy, it’s hard to beat buying at a discount and selling at full value.
A Few Stocks That Are Priced at a High Discount to Fair Value
Currently, quite a few stocks have market caps of less than a third of fair value, according to my seven-factor formula. But most of those are pretty tiny companies. Of companies in the S&P 1500, the following five are clearly underpriced: Brighthouse Financial (BHF), Endo (ENDP), Genworth Financial (GNW), H&R Block (HRB), and Seneca Foods (SENEA). That doesn’t mean, however, that they are all good investments. If you’re willing to go smaller, I would favor the following underpriced stocks for a sell-when-price-approaches-fair-value approach, though some of them may be difficult to buy in quantity due to limited liquidity: Big 5 Sporting Goods (BGFV), Ingles Markets (IMKTA), Medical Facilities (MFCSF), Mannatech (MTEX), and Summer Infant (SUMR). Not only are they selling for less than a third of their fair value, they all rank pretty highly on the various ranking systems I’ve designed on Portfolio123.
Full Disclosure: I am long MFCSF, MTEX, and SUMR.