

Why Momentum Works
The Evidence: Momentum Works
As a factor, momentum—the idea that a stock’s relative returns over the past six to twelve months have a tendency to persist over the next six to twelve months—has proved remarkably resilient. Academics first recognized this factor in the early 1990s, and its return premium has since been verified over the past 220 years (no, this is not a typo) of US equity data. As Clifford Asness and his colleagues documented in a 2014 paper entitled “Fact, Fiction, and Momentum Investing,” there have been over 25 years of out-of-sample evidence of momentum, in forty countries, and even in a dozen other asset classes.
Using Portfolio123, I looked at the performance of the Russell 3000 since 1999 if divided into deciles according to momentum over various lookback periods, with monthly rebalancing. I then calculated the slope of those deciles (with the lowest decile getting an x value of 1% and the highest 10%), and also looked at the difference between the top decile and the bottom decile. Here are the results:
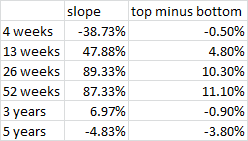
It’s pretty clear that over short periods (4 weeks or less) and long periods (5 years or more), price returns revert to the mean; over six- and twelve-month periods, momentum prevails.
(I should add that when looking at momentum decile returns, the difference between the top three deciles is minimal but the difference between the bottom three is huge. Momentum, like many factors, is more effective at identifying losing stocks than winning ones.)
The Explanations So Far
Yet there has been no general agreement on why momentum works. As Asness and his colleagues write, most of the theories fall into two categories: risk-based and behavioral. I’ll outline these theories briefly.
Behavioral explanations explain momentum as either an underreaction or a delayed overreaction. In other words, either momentum happens because new information filters into the market and then the market takes some time to catch up with it, or because investors chase returns, providing a feedback loop that chases prices higher.
These explanations, of course, contradict each other. The second might explain momentum well if it were a two-to-four-week phenomenon, but price returns tend to revert over such a short period. As for the first explanation, why would it take six months for information to filter into the market? Why wouldn’t it take two weeks? The only explanation for momentum that can make sense has to be one that explains why momentum works well if using a six-to-twelve-month lookback and does not work well for shorter or longer periods.
The risk-based explanations are, first, that high-momentum stocks face greater cash-flow risk because of their growth prospects, and second, that they face greater discount risk because of their investment opportunities. Both would give them a higher cost of capital. These explanations make more sense to me than the behavioral ones, but not much. At least they conform with the six-to-twelve-month outlook. But they seem like a stretch. And the second explanation is incompatible with the risk-based explanation for the value factor. In general, I don’t like risk-based explanations for factors because I don’t believe that risk and return have a linear relationship, and because many factors work because they reduce risk.
I think there are some alternative explanations that are quite a bit simpler. The first is regulatory; the second is just common-sense.
Alternative Explanations
- Tax law encourages investors to sell losing positions.
- Companies that outperform are more likely to continue to outperform than companies that underperform, and companies that underperform are more likely to continue to underperform than companies that outperform. Since companies that outperform tend to increase in price and companies that underperform tend to fall in price, momentum is a natural consequence of the persistence of performance.
Both these reasons make sense with the six-to-twelve-month optimal lookback period for momentum strategies, and are compatible with long- and short-term price reversal.
Let’s drill down a little deeper into each one.
The Taxation Explanation
Tax law currently encourages investors to sell losing positions and to hold winning positions, thus contributing to momentum. Taxation of capital gains has been a constant in the United States for over one hundred years, and is imposed in a large majority of other countries as well. A capital gain is the result of selling a winning position; a capital loss reduces capital gains. So there has been some tacit governmental encouragement to sell losing positions and hold onto winning ones.
Let’s look at how this works. You invest in two stocks, A and B. After a while, A posts a gain and B posts a loss. Now let’s say you want to sell A. Without capital gains taxes, your decision to sell A would be completely independent of your decision to sell or hold onto B. But given capital gains, it makes much more sense to sell B at the same time as you sell A. Thus capital gains taxation contributes significantly to negative stock momentum.
Because capital gains taxes are calculated on a year-to-year basis, and because most institutions tend to hold stocks for about a year, this explanation conforms pretty well with the six-to-twelve-month optimal lookback period for the momentum factor.
The flaw in this explanation is that it only covers the last hundred years or so, and some studies show that momentum was a factor even before then.
The Performance Explanation
What’s a good measurement for performance? Clearly, one that correlates well with future price increases but actually is independent from price.
I’ve chosen free cash return on assets, measured quarterly to avoid any data infiltration. Companies with a high ratio of free cash flow to total assets tend to perform well; companies with a low ratio tend to perform poorly. There are plenty of other performance measures that one could choose instead. But please note that I didn’t test a bunch of factors and then choose one that I thought would persist. I chose this factor because it correlates well with future price increases and therefore, in my opinion, signifies something about company performance.
Indeed, this ratio measured at one point in time and measured again 12 months later has a correlation ranging from 0.6 to 0.9, which is astonishingly high for a ratio based solely on one quarter’s data. But measured over a five-year period, the correlation range drops to 0.2 to 0.4, depending on what that five-year period is.
According to my second explanation, momentum is a proxy for company performance. If a company’s performance is strong, its price is going to rise. If its performance continues to be strong, its price will continue to rise. Therefore, a company whose price is rising now is likely to have a rising price a year from now, and a company whose price has risen over the last year is likely to experience a continued rise in price simply due to the momentum of its performance. And the exact reverse is true for companies with poor performance.
The flaw in this explanation is that it doesn’t account for mean reversion after five years—or after four weeks.
But there’s a solution to this. Price returns in general tend to revert to the mean because their movements often appear to be random, and mean reversion is a characteristic of all random variables. (The farther a random variable is from the mean, the more probable it is that it will reverse course.) Price returns are not random, strictly speaking, but they do have many of the characteristics of random variables.
The momentum of company performance is so strong in the six-to-twelve-month period, however, that it overrides that mean-reversion tendency. Performance momentum in a four-week period is meaningless since one usually measures performance by looking at quarterly statements; performance momentum over five years is simply not strong enough to overcome the natural tendency of price returns to mean revert.
Implications of the Quality Theory of Momentum
The quality theory of momentum, stated in different words, is: If returns are, in part, a sign of company performance, and if relative company performance tends to persist over a certain period—i.e., there is a positive correlation between company performance in two different periods—then the returns over those two different periods will show a stronger resistance to their natural tendency to revert to the mean than over two periods for which the correlation of company performance is weak or difficult to measure.
I admit, that’s a mouthful. But it seems logical.
Momentum, then, is a proxy for company performance. If one can find good measures of company performance that are independent of stock prices but correlate well with future returns, then those measures are preferable to momentum measures. And thankfully, there are dozens of such measures.
One can break down factors into six main types.
- Value: the ratio of something in a company’s financial statements to its price.
- Quality: the ratio of something in a company’s financial statements to another thing in a company’s financial statements (this group of factors includes many growth measures).
- Size: a measure of how big or small a company is.
- Momentum: a measure of the relative returns of a stock over a certain period of time.
- Sentiment: factors that indicate the feelings of investors about a company.
- Volatility: factors that measure deviation and beta, along with other measures of price and volume that have to do with risk.
There are, of course, a few factors that don’t fit into any of those categories, but not many.
My takeaway from the Quality Theory of Momentum is that one should emphasize quality factors over momentum factors because the latter are secondary in nature and the former are primary. In the systems I use to choose stocks, value factors have a combined weight of 15% to 20%, quality factors have a combined weight of 45% to 50%, while momentum factors only have a combined weight of between 5% and 10%. (Size and volatility factors also each have combined weights of between 5% and 10%, while sentiment factors have a combined weight of between 10% and 15%.)
There are, however, certain elements of a company’s quality that are impossible to measure. Financial statements go a long way in outlining to investors how a company is doing, but not all the way. There are always some pesky unquantifiable factors. And that’s why momentum can be so useful as a proxy for quality. One ignores momentum—especially negative momentum—at one’s peril.
2 Replies to “Why Momentum Works”