

Did What Works on Wall Street Stop Working?
This article is the sixth in a series about screens designed by famous investors. The first was on Benjamin Graham; the second was on William O’Neil; the third was on Joel Greenblatt; the fourth was on Ken Fisher; the fifth was on Joseph Piotroski; and for an overview of the subject, see my article “Can Screening for Stocks Still Generate Alpha?”
James P. O’Shaughnessy’s What Works on Wall Street has long been one of my favorite books on investing.
Not because it’s so readable—it includes pages and pages of backtests that are a real slog to get through. And not because it’s impeccable—there are some odd omissions, which I’ll get to later. And not because it strikes an estimable balance—there’s simply not enough about accounting measures, and what’s there is somewhat weak.
It’s because O’Shaughnessy’s approach has always struck me as the most sensible approach to stock selection, and prior to O’Shaughnessy, as far as I’m aware, nobody had proposed it. It is, in a nutshell: study assiduously what stock-picking factors have worked best in the past and combine those factors to pick stocks for the future. This is what I do every day, and it has made me a wealthy man.
What Works on Wall Street (WWOWS) was originally published in 1997, then went through three more editions, in 1998, 2005, and 2012. Each time, O’Shaughnessy refined his factors and found new ones. Each time, he was able to boast that his approach still worked.
But if O’Shaughnessy were to revise his book for a fifth edition, I’m afraid he’d have to temper that claim.
The O’Shaughnessy Screens
At the end of the fourth edition O’Shaughnessy concludes that two strategies out of all the ones he’s outlined are the best—“one for investors willing to take market risk and one for very conservative investors.”
Both start with what O’Shaughnessy calls the “All Stocks” universe, which excludes stocks with an inflation-adjusted market cap less than $200 million. Because O’Shaughnessy sets that $200 million limit in December 2008, the limit today would be $249 million. Using Portfolio123, I can write a rule for that limit using the Consumer Price Index. This leaves us with just a little more than 4,000 stocks. (If you’re a Portfolio123 subscriber, you can access the universe.)
Both use a ranking system O’Shaughnessy calls “Value Composite 2.” It has six equally weighted components: price-to-book, price-to-earnings, price-to-sales, EBITDA/EV, price-to-cash-flow, and shareholder yield (buyback yield, as measured by share reduction, plus dividend yield). (O’Shaughnessy and I actually use the reverse of the first five ratios—earnings yield, etc.—which enables us to rank stocks with negative income, EBITDA, etc.). (Here’s the ranking system.)
For Very Conservative Investors
O’Shaughnessy’s conservative screen invests in the top 25 stocks in the staples sector according to shareholder yield and the top 25 stocks in the utilities sector according to Value Composite 2. Portfolios are formed every month and held for one year. I’m starting my backtesting in January 2010, since the last portfolio that O’Shaughnessy tested was in December 2009. This 50-stock portfolio has an average annual return of 11.57%. An equally weighted portfolio of stocks from the “All Stocks” universe gets only 10.35%, so this strategy is a modest improvement on random stockpicking (though not on the S&P 500). (Here’s the screen, but you first have to copy the universe linked above.)
Trending Value
The strategy for investors willing to take market risks is called “Trending Value.” It takes the stocks that rank in the top 10% of the All Stocks universe by Value Composite 2 and winnows those down by buying those with the greatest six-month price appreciation. (Here’s the screen, but you first have to copy the universe and ranking system linked above.)
Once again we form portfolios every month and hold for one year. The results are not good. The average 25-stock portfolio earned only 8.41%, and a 50-stock portfolio earned only 8.53%. You’d have been better off just choosing stocks at random.
What Went Wrong?
O’Shaughnessy is nothing if not a careful backtester. But backtested results often don’t survive out of sample.
Let’s start with O’Shaughnessy’s Value Composite 2 ranking system. O’Shaughnessy is fond of decile ranking, and gives dozens of examples in his book. If we take Value Composite 2, though, and look at how stocks in the All Stocks universe have performed since January 2010, with annual rebalancing, we get a complete reversal of how they performed in his book:
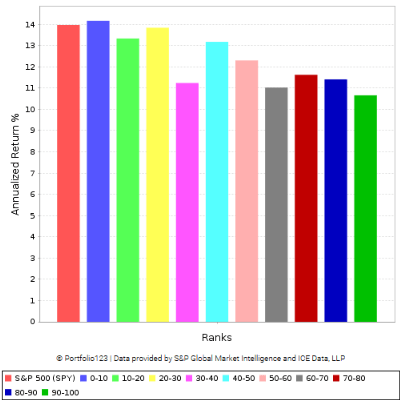
The red bar at the left is the performance of the S&P 500. The stocks in the All Stocks universe that performed best were those ranked lowest—the most expensive stocks (the blue bar on the left). Those that performed the worst were the cheapest (the green bar on the right).
Let’s look at how these same stocks performed according to their six-month price appreciation.
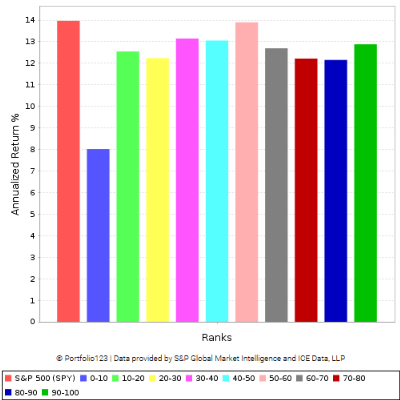
That’s a little bit better, but not a whole lot. Stocks with poor six-month price appreciation did not do well, but those in the other nine deciles all performed about equally well. It seems that neither of the factors that O’Shaughnessy was so bullish about have worked since the last date of O’Shaughnessy’s published backtests.
Some Modest Improvements
Without doing any further backtesting, I want to suggest some modest improvements to O’Shaughnessy’s “Trending Value” screen.
- O’Shaughnessy’s model favors stocks in certain industries, because some industries, by their very nature, have much higher earnings yields, shareholder yields, and so on, than others. For example, running O’Shaughnessy’s “Trending Value” screen today means that 26 out of the 50 stocks will be in the financial sector, and only one will be in the health care sector. It makes common sense to have a more industry-neutral value system. If we rank each stock on its six value ratios against other companies in the same industry rather than against all other companies, our results should improve.
- It makes little sense to rank stocks on their six-month momentum and then hold them for one year (O’Shaughnessy practically admits as much). And you certainly aren’t buying them at their cheapest price. I suggest ranking them on their twelve-month momentum, measured one month ago. This is hardly a newfangled approach—it’s a classic momentum strategy that has been in use for well over twenty years.
- Stocks with consistent growth tend to outperform stocks with inconsistent or negative growth. And a great deal of a stock’s intrinsic value depends on its growth prospects. This is a measure that O’Shaughnessy does not examine in his book. Instead he simply looks at one-year EPS growth, which tells you relatively little about a company, and he ranks on that factor, so that stocks with one-year growth of 400% rank much higher than those with one-year growth of 20%. This measure, he finds, largely fails. Most investors I know would rather own a company with consistent 20% yearly EPS growth over the last five years than a one-year EPS growth rate of 400%, which is clearly unsustainable. One way to measure consistent growth is simply to count the number of quarters over the last five years in which a company’s EPS has been greater than its EPS in the same quarter a year ago. You get a number between zero and twenty. I suggest we add this to our ranking system and give it one-quarter of the weight of the system. (You can see my improved ranking system and my improved screen.)
Results of the Improved Trending Value System
With a portfolio of 50 stocks, we now get a one-year return of 12.99% using the same parameters for our backtest; with a portfolio of 25 stocks, we get a one-year return of 13.23%. Both of those are a good deal better than the one-year return of an average stock over the same time period.
Supercharging the Trending Value Screen
I suggest we go farther. Let’s cut the holding period to three months and lower the liquidity threshold to $100 million market cap as of 12/2008 ($125 million as of today).
We now get a 91-day return of 4.10% for the 25-stock portfolio, which is a one-year return of 17.49%. Yes, if you have a cash account, your taxes will go up, and yes, if you’re investing $100 million in this strategy you might suffer from some market impact buying the smaller stocks. And you’ll have to pay more in transaction costs as well. But the difference in returns is so substantial that it may be worth the cost.
Conclusions
O’Shaughnessy, I believe, wanted to keep things as simple as possible in his book. But the way he deals with industries and time frames is just too simple.
Many ratios, whether value, quality, or growth, should be measured against comparable companies in their sectors, subsectors, or industries rather than against stocks as a whole, and that’s not something O’Shaughnessy has ever done in the various editions of WWOWS.
Moreover, O’Shaughnessy doesn’t really indicate the time frame for his measures. He simply says “Price to Earnings” or “Price to Sales” without telling us if he’s using annual figures, trailing-twelve-month figures, or three-year averages (I used trailing twelve-month figures for value ratios). And often you’ll want to look at three-year or five-year measures (particularly for measuring growth and quality). O’Shaughnessy doesn’t do so in his book.
On the whole, I still think WWOWS is one of the best books ever written on investing. Not only is O’Shaughnessy’s approach irreproachable, his writing is excellent and his approach to backtesting is exemplary.
But in a world where screening for stocks is rampant, sophisticated algorithms are governing multi-billion-dollar portfolios, and every stock of a certain size has been scrutinized to death by thousands of professional investors, the simple approaches that O’Shaughnessy suggested may no longer work. One needs to increase the level of sophistication, of complexity, in order to beat the market. O’Shaughnessy was correct in telling us how to find out what works on Wall Street, and was correct in his conclusions. The fact that his strategy design ended up failing should not invalidate his approach. It only took a few minor tweaks to convert it into a successful strategy again, even in a market which has been remarkably unfriendly to value investing over the last ten years.
In other words, What Works on Wall Street still works, even if one of O’Shaughnessy’s particularly favored strategies failed.
A Few “Trending Value” Investments
Here are ten stocks in the All Stocks universe that, according to the revised “Trending Value” screen, should do well over the next year. I list them in order of twelve-month momentum measured a month ago: Apollo Healthcare (AHCCF), Jaguar Mining (JAGGF), Big Five Sporting Goods (BGFV), Quidel (QDEL), Canaccord Genuity (CCORF), Halozyme Therapeutics (HALO), Superior Group (SGC), Big Lots (BIG), B. Riley Financial (RILY), and Tronox (TROX). These stocks rank in the top decile according to the improved Value Composite 2 ranking system using both Compustat and FactSet data, so they seem genuinely low-priced.
Disclosure: I am long CCORF, JAGGF, and BGFV.
Nice post Yuval! Really like the additional factors you suggest – consistent growth in fundamentals totally makes sense to include, and is a nice complement to the “snapshot” metrics like P/E, EV/EBITDA, etc.
And while I love JPO’s books, you are totally correct to point out that continuous refinements in each new edition should garner some skepticism about the durability of the strategies presented going forward. We know that value based strategies have under performed since ~2010 or so, the start time of the this backtest, primarily due to value being short tech, and long financials+energy. Particularly from 2017-2020, large cap tech and many unprofitable high growth names have done very well. But in recent months, small cap value has outperformed quite strongly. So maybe we are the cusp of a revival in value-based strategies going forward?
Well, this article aged poorly. A portfolio of the stocks that were listed in the conclusion would have had poor returns if held for 1 year like the original trending value portfolio. One of the stocks was bought out while another declined by 50%, though there were some gains.