

How to Predict a Stock’s Growth
If you were given a crystal ball that would accurately predict a company’s growth over the next year, you would logically invest in those companies with the highest growth and short those with the lowest. Portfolio123 recently allowed this kind of crystal-ball prediction in its backtesting by allowing negative numbers to be used as a parameter in its “FHist” function, which normally takes a factor and gives you its value X weeks ago.
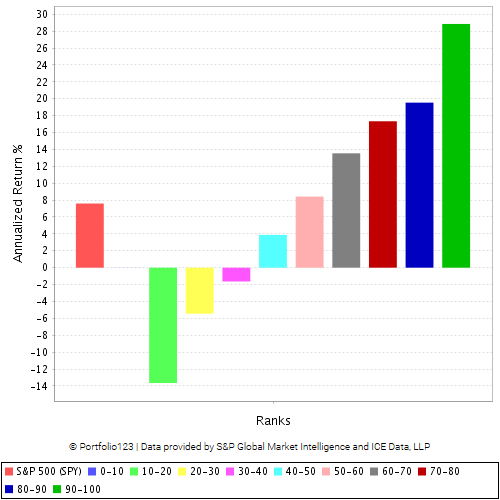
Now one can use, as a factor, TTM EPS growth any number of weeks ahead, and one can test its “bucket” or decile performance. Naturally, it looks stellar, as does sales growth, EBITDA growth, free cash flow growth, and operating income growth. The bucket charts all look like this, more or less:
Because the bucket charts of past sales growth look more like this—

—I was worried that this would be the case with future growth too. But it’s not at all.
Therefore, it’s worthwhile considering how we can best predict future growth. Not only will this provide us with extremely valuable factors to use in ranking systems, but it will enable us to better estimate the intrinsic value of companies, since growth is a major factor. I had written some earlier articles on predicting EPS and sales growth, but those suffered from certain methodological limitations. I found that low profit margin was a terrific predictor of EPS growth, but obviously such a factor would be useless in predicting sales growth. Using these new look-ahead functions, I can now analyze a huge amount of data and isolate those factors that predict growth—not only in sales and EPS but also in free cash flow and EBITDA—best.
My procedure will be as follows. I will gather the ranks of a large number of factors on a variety of dates going back 22 years and compare them to 65-week look-ahead numbers for trailing twelve-month sales, EPS, EBITDA, and free cash flow growth. (I use 65 weeks to allow a three-month buffer so that there’s a minimum of data commonality between the past and future periods.) I will then examine the data for rank correlation and see which factors correlate best with the look-ahead numbers.
After that I’ll look at what factors best predict 5-year growth, using a similar method.
Predicting one-year EPS growth
Here are the five factors most predictive of EPS growth:
- High analyst estimates. Estimates for the current fiscal year compared to last fiscal year, the current quarter compared to the same quarter last year, the next quarter compared to the same quarter last year, and so on are good harbingers of future growth. (Comparing next fiscal year’s estimates to the current fiscal year’s estimates, however, is relatively useless.)
- Strong momentum. Investors are almost as good at predicting growth as analysts are. Any momentum measure ranging from six months to twelve months will work, and weighting by volume will give an extra boost.
- High P/E. It’s well known that P/E correlates well with earnings growth, and it makes perfect financial sense. The higher the P/E, the higher you should expect the company’s growth to be.
- Low ROA, ROE, and net profit margin. Companies with low returns or profit margins are more likely to experience high growth than companies with high returns or profit margins, and companies with high returns or profit margins are more likely to experience low growth. Why? Because these ratios compare earnings with the stuff that drives those earnings (assets, investment, and sales). A company with low earnings but high sales is going to grow its earnings faster than a company with high earnings and low sales. It’s regression to the mean at work.
- Low accruals. Companies with low accruals are more likely to experience high growth than companies with high accruals—if you measure accruals by the ratio of net income less operating cash flow to total assets or to the absolute value of net income. Companies with low accruals are companies with low earnings when compared to operating cash flow and assets, and those companies are likely to see an increase in earnings.
One factor that is, perhaps surprisingly, not predictive of EPS growth: past EPS growth, using any measure you choose (in fact, TTM EPS growth is a strong negative indicator of future EPS growth).
Predicting one-year sales growth
Here are the five factors most predictive of sales growth.
- Strong sales estimates. The current fiscal year’s sales estimate compared to last fiscal year’s sales is an excellent indicator; next fiscal year’s sales estimate compared to the current fiscal year’s is also good.
- High asset growth. Growth in total assets is an excellent indicator of growth in future sales.
- Strong past sales growth. The best measure is the sales in the most recent quarter compared to sales in the same quarter last year, but other measures will work as well. Sales acceleration should be examined too: the difference between the aforementioned recent quarter sales growth and the TTM sales growth.
- High price to sales. The higher the price-to-sales ratio, the higher you should expect sales growth to be. Investors have a pretty good bead on sales growth, and this is how they express it: by driving the price up.
- High enterprise-value-based ratios. EV to Sales, EV to EBITDA, EV to gross profit, and EV to research-adjusted assets (assets adjusted for capitalization of R&D) are all excellent negative indicators of sales growth. If you want companies with high sales growth, look at the companies with terrible numbers on ratios like these. Value and growth are, in this and many other instances, diametrically opposed. Sales growth is expensive.
Predicting one-year free cash flow growth
Mean reversion dominates here. Of every single factor I tested, with one exception (which I’ll get to below), the only ones that worked were those that measured free cash flow in the recent past, and all of them were negative indicators of future free cash flow (in other words, stocks with high free cash flow now should expect low growth and stocks with low free cash flow now should expect high growth). The strongest negative indicators were unlevered free cash flow to enterprise value and free cash flow to market cap. But just about anything that indicates strong free cash flow or operating cash flow will work as a negative indicator: low accruals, good free cash flow margin, strong operating cash flow to assets, strong cash flow return on invested capital, decrease in current operating working capital, and so on. Even free cash flow growth over the prior year is a pretty good negative indicator of future free cash flow growth. The principle is clear: the best way to predict free cash flow growth is to compare recent free cash flow with another thing and bet on those stocks with the worst numbers. No other factor I examined came close to this kind of predictability.
The one exception is, as one might expect, free cash flow estimates, particularly the current year’s estimate compared to last year’s number. But this was not nearly as predictive as the negative indicators I described above.
Here are a few other things that are very slightly predictive of free cash flow growth, though the correlations are so low that I hesitate to mention them: EPS estimates; operating income growth if measured from the current quarter back to the same quarter last year; consistent sales growth, as measured by the number of quarters over the last four years in which sales were higher than the same quarter the previous year; and asset turnover.
Predicting one-year EBITDA growth
Here are the five factors most predictive of EBITDA growth:
- High EBITDA estimates. The estimate of the current year’s EBITDA compared to last year’s EBITDA is a good indicator; somewhat weaker, but still valuable, is next year’s EBITDA estimate compared to this year’s.
- High EPS estimates. In particular, the current quarter’s and next quarter’s EPS estimates compared to the same quarters last year, and the current fiscal year’s estimate compared to last fiscal year’s.
- Strong recent EBIT or EBITDA growth. In particular, the current quarter’s numbers compared to the same quarter last year.
- Strong price momentum. Especially volume-weighted momentum. Also check out how close the stock is to its ten-month high, and look at six-month price momentum.
- High sales estimates. Comparing the sales estimate for the current fiscal year to that of the previous fiscal year is also a good predictor of EBITDA growth.
Predicting five-year (long-term) growth
The results here aren’t terribly different from those for one-year growth.
For EPS, the five most potent factors are:
- Strong analyst estimates (especially current fiscal year’s EPS compared to last year’s and next fiscal year’s compared to current).
- High P/E.
- Low net profit margin.
- Low ROA.
- Low percentage operating accruals (i.e. take net income, subtract operating cash flow, and then divide by the absolute value of net income).
For sales, the five most potent factors are:
- High recent sales growth.
- High sales estimates.
- High price-to-sales.
- High asset growth.
- High EV to research-adjusted assets.
For free cash flow, the five most potent factors are:
- Low unlevered free cash flow to enterprise value.
- Low free cash flow to price.
- Low free cash flow to assets.
- Low free cash flow margin.
- Low CROIC (cash flow return on invested capital).
For EBITDA, the most potent factors are:
- Low EBITDA/EV ratio.
- Strong analyst EBITDA estimates.
- Low earnings yield.
- Low operating profits yield (EBITDA minus interest expense divided by market cap).
- High estimated sales growth.
Note that with the significant exception of sales growth, past growth was not particularly predictive of future long-term growth.
Conclusions
How can we use these results?
One way is to use them to estimate growth for an intrinsic value calculation.
But if you simply want to invest in strong growth stocks in general, I suggest you heed the following six counsels:
- Pay attention to analyst estimates. Compare them to actuals or to GAAP numbers for the recent quarters and fiscal years.
- Try to calculate intrinsic value rather than using value ratios. Intrinsic value calculations always take growth into account. Comparative value calculations usually don’t. If you don’t want to calculate intrinsic value, use forward earnings yield (but not forward price-to-sales), PEG-like ratios, and R&D to market cap. If you’re looking for growth, avoid stocks with low price-to-sales and EV-based ratios.
- Consider price momentum. For best results, use six-to-twelve-month numbers.
- Pay attention to the most recent earnings report. Does it show a lot of growth in sales or operating income compared to the same quarter last year? If so, that’s a good indicator that things are going well.
- Look at ROA, net profit margins, and an increase in operating cash flow as negative indicators. Remember that stocks with strong earnings and cash flow growth in the near future may well have very low profitability numbers at the moment.
- Never mistake past growth for future growth. Except in the case of sales growth, they have very little to do with each other.
Lastly, keep in mind that a company’s growth prospects are usually already reflected in a stock’s price, as I’ve shown with the momentum and valuation measures discussed above. I make it a rule never to invest in a stock unless I think it’s at least somewhat underpriced, no matter how strong its growth prospects may be. Growth, despite its promise, is not the be-all and end-all of investing.
Terrific article. Thanks.
Great article! How do you compute volume-weighted momentum?
There are various ways to do it, but the way I was thinking of takes the average daily dollar volume divided by the average volume and compares that to a point in the past.
Thank you! How many daily bars you average over?
I like to compare VMA (15) to VMA (210), but I lag that about 3 weeks so I can buy on the dip.
Thank you!
Thank you!