

How to Design a Fundamentals-Based Stock Strategy that Really Works, Pt. 1: Factor Design
I have been using a strictly quantitative process to buy and sell stocks for the last six years, with excellent results: I have a CAGR of 46% over that period, and have made over $3 million. In this series of articles, I’m going to give you a point-by-point method by which you can, if you’re diligent, duplicate or exceed my success. And it all starts with factor design.
What Are Factors?
A factor is simply a reason to buy a stock.
- Is it cheap?
- Does the company have a brilliant CEO?
- Is the industry poised to make a comeback?
- Is its market share increasing?
Only some factors are quantifiable. Others are qualitative. “Is it cheap” and “Is its market share increasing” are quantifiable. “Does the company have a brilliant CEO” and “Is the industry poised to make a comeback” are qualitative.
Only some quantifiable factors have readily available data. For example, the book value of a company’s fixed assets is ascertainable by looking at its balance sheet. But the market value of those assets is a matter of conjecture.
Designing quantifiable factors that have readily available data is the subject of this article.
What Makes for a Good Factor?
- Does it make sense? A beginning investor recently wanted to use EPS as a factor. But two companies with exactly the same net income can have totally different share counts. And two companies with exactly the same EPS can have different prices per share. EPS on its own will tell you nothing. Another example: the price you pay for a stock in relationship to its earnings or sales makes some sense, but the price you pay for a stock in relationship to its inventory doesn’t.
- Does it have an “edge”? Very common factors may not work as well as unusual ones. Take book-value-to-market-cap, for example. Once everyone started using this factor to define value, stocks with low book-to-market ratios had very clear reasons to be “cheap.” There was little mispricing left. That is the nature of arbitrage: once everyone is using a factor, it stops working.
Combining Factors
One of the best ways to pick stocks is to take a lot of quantifiable factors with readily available data into account at once. In other words, you can create a system that evaluates every stock from a large number of different angles.
Using multi-factor ranking is a great way to accomplish this. (Machine-learning tools and multiple regression analysis are two alternative methods.)
Let’s say you were putting together a fantasy basketball team based on statistics. Among the things you want to consider when choosing players are their points, rebounds, assists, blocks, 3-pointers, and steals per game; you also want to consider their heights, age, field goal percentage, and games played. How are you going to put all those things together? Well, you could assign each player a number between 0 and 100 on each of those things, multiply each one according to the factor’s importance, and then add all the results together. That’s exactly what multi-factor ranking does.
Factors have to be considered in combination. The number of games played has little to do with a player’s future ability, but it heightens the relevance of the other factors. The same thing goes for company size. Smaller companies do not tend to outperform larger companies; but small size amplifies the effect of other factors.
Then there are factors that work for some stocks and not for others. Inventory reduction is a great factor for companies in some industries and entirely irrelevant for others.
Essential Factors
I’ve often said that buying a stock is like buying a used car. You want to look at it from every angle. You want to look: under the hood, at the price on the windshield, from the driver’s seat, under the carriage, on the Internet.
Now let’s say you were evaluating a used car and you forgot to look at the mileage. That would be stupid. What if you forgot to look at the price? That would be stupid too. What if you forgot to have someone check the brakes? That would be not only stupid, but dangerous.
But what if you forgot to check whether you can easily adjust the side mirrors from inside the car? That wouldn’t be so bad.
The same is true for stock-picking. If you pick stocks based purely on their comparative value, you’re not looking at a huge number of essential factors. If you pick them based purely on their growth potential, or their price appreciation, or their profitability, or their volatility, you’re bound to pick some real losers.
Yet this is what people do. They invest in “smart beta” funds that look at only one thing. Or they believe in Greenblatt’s “Magic Formula,” which only looks at two things. Or they’ll use a screener to pick stocks, most of which can only look at six things at most.
There are only two ways to consider all the essential factors that may affect the future price of a stock. The first is to read all the earnings reports, get outside opinions, listen to the earnings calls, follow the price charts, and so on. The second is to use a systematic, multifactor analysis of the stock’s fundamental data, which is best done using Portfolio123‘s Research tools.
Now it’s not at all easy to tell if a factor is essential or inessential—or, for that matter, entirely beside the point.
But, as my used car analogy makes clear, it’s far better to have too many factors than not enough. Using a factor that doesn’t work very well (checking the side mirrors) isn’t going to hurt your analysis much. But missing an essential factor (checking the brakes) will.
Seven Types of Factors
I classify factors into seven types:
- Value
- Growth
- Quality
- Technical
- Sentiment
- Stability
- Size
The first three (value, growth, and quality) I call fundamental factors. These require at least a basic understanding of financial statements. If you don’t have such an understanding, I suggest reading Mihir Desai’s How Finance Works or taking the free courses offered by the Corporate Finance Institute: “Accounting Fundamentals,” “Reading Financial Statements,” and/or “Introduction to Corporate Finance.”
It’s also very important to remember that fundamental factors are more or less impervious to statistics. In my basketball analogy, you can work with completely objective statistics such as height, weight, age, or field goal percentage. But not in finance. Every single number on a financial statement is an interpretation by the company’s accountants and officers. There’s nothing “objective” about them. Can you subject interpretations to statistical analysis? Maybe you can. But take the results with a huge helping of salt.
Value Factors
Value factors compare something about the company to its per-share price, its market cap (preferably fully diluted), or its enterprise value. The “something about the company” has to match the thing you’re comparing it to.
- For price comparisons, use per-share values.
- For market cap comparisons, use levered values—values adjusted for the equity portion of the firm. For example, deduct interest expense from operating income, or deduct debt from assets.
- For enterprise value comparisons, use unlevered values—values adjusted for the entire firm (include all debt-related items). For example, in calculating free cash flow, we deduct the after-tax interest expense. You want to add that back when you’re comparing free cash flow to enterprise value.
Many value factors should be compared to firms in the same sector, industry group, or industry.
Keep in mind that there are two ways to structure value factors: price-to-earnings or earnings yield. If you divide price by earnings, you’re looking for lower numbers; if you divide earnings by price, you’re looking for higher numbers.
Watch out for negative values. What do you do with EV/EBITDA if EBITDA is negative? What if EV is negative? What if both of them are negative? It’s important to configure your formulas to take into account the possibility of negative numbers.
Don’t use enterprise value–based formulas for evaluating banks and insurance companies. Debt means something entirely different for such firms. It’s their lifeblood.
Growth Factors
Growth factors look at the year-by-year or quarter-by-quarter change in the fundamental part of a value factor. For example, the five-year change in asset turnover is not a growth factor, but the five-year change in its components—assets and sales—are. In general, I do not classify ratio changes as growth factors, nor do I classify factors that have price data.
You might think that a growth factor might be simply present value – past value or present value / past value. But the first isn’t scaled by anything, and the second ignores the possibility of negative numbers. The actual formula is
(present value – past value) / absolute value of past value
When a value factor can be negative or zero, growth gets a bit weird. But there’s no good alternative.
Also, when the denominator is tiny, the growth may be way out-of-proportion to that of other stocks. One way to ameliorate this is to set a lower limit to the denominator. For example, if you’re looking at EPS growth, you could use
(present EPS – past EPS) / maximum (absolute value of past EPS, $0.05).
Not all growth is good! Would you rather invest in a company with a steady 15% EPS growth over the past five years or one with a 400% EPS growth over the last year? One is sustainable, the other is not. So you might have to adjust growth factors to favor companies with middling growth, or strong but not excessive growth.
There are lots of ways to do this.
- You could write a formula for a parabolic curve with the open end pointing downward (a formula that looks like –ax2 + bx + c) and use the growth rate in place of x.
- You could rank with lower values better on the difference between the growth rate and the absolute value of the rate that you want to rank the highest (for example, |asset growth – 7.5%| would be zero—and therefore rank highest—if asset growth were 7.5% and would rank significantly lower if it were –5% or 20%).
- You could assign points to different growth ranges and then rank them.
Alternatively, you could design a factor that measures the consistency of a company’s growth. For example, in how many of the last twelve quarters has the company’s EPS been higher than the same quarter a year earlier?
Lastly, there are some non-growth factors that are predictive of future growth. It might be worthwhile looking at some of those.
Quality Factors
These are all the rest of the fundamental factors: factors based on financial statements that are neither growth nor value factors. There are a huge variety of such factors, and the possibilities are practically limitless. Almost all of them are financial ratios: asset turnover, gross margin, return on equity, net operating assets to total assets, operating accruals to net income, operating cash flow to sales, capital expenditures to gross plant, debt to EBITDA, and so on.
They can include factors that depend on change from year to year, or are simply ratios of one value to another, or are a combination, like the change in a ratio from one year to another. In that case, you can express the change as either a difference or, if you’re careful about negative numbers, a quotient.
I use far more factors in this category than in any other.
Sentiment Factors
Most sentiment factors are based on recent changes in analyst estimates (or recommendations). These are not very useful for long-term investments, but for short-term trades they can work wonders. The same goes for insider buying (you can safely ignore insider selling, since insiders sell for all kinds of reasons that have nothing to do with the prospects of the company).
Some sentiment factors that might be good for long-term investing include analyst recommendations, institutional ownership, and short interest.
Technical Factors
Technical factors are based on price and volume. You should approach these factors with great care, because they can be deceptive and because the logical explanations for them can be unclear or absent. Other factors can usually be relatively easily explained; technical factors often work in mysterious ways.
These factors come in six general categories:
- Charting. There have been a number of academic studies of charting, and they come to the conclusion that it doesn’t work. I do not recommend reading price charts. It’s distracting, time-consuming, and has an extremely inconsistent track record.
- Mean Reversion. In probability, the law of regression to the mean states that a variable will be more likely to be closer to than farther from the mean in the future. This depends on the imperfect correlation of data. For example, if taller parents always produced taller children and shorter parents always produced shorter children, there would be a perfect correlation and no regression. But because there’s an imperfect correlation between the heights of parents and their children, the children of two parents who are over seven feet tall are unlikely to be over seven feet tall themselves. Instead they’ll be a little closer to the average height. When applied to stock prices, this law becomes the principle of mean reversion. It says that a stock whose price has risen or fallen relative to the market is more likely to reverse course than to continue in the same direction. There are important price-related factors that can overcome mean reversion, including momentum and post-earnings announcement drift, which I’ll discuss next. Mean reversion tends to work best over periods shorter than three months and longer than two years.
- Momentum. Momentum is a phenomenon of a stock’s price continuing to drift farther and farther from the mean in contradiction to mean reversion. It’s a reflection of a company’s perceived performance and the slowness of the process of arbitrage. Let’s take two companies, A and B. A looks like it’s growing and becoming safer and healthier; B looks like a company in decline. A’s price will rise and B’s price will fall. As time goes on, A is more likely to continue to have good things happen to it than B, so A’s price will continue to rise as B’s continues to fall. This phenomenon is so powerful over a six- to twelve-month time period that it overcomes the natural tendency of mean reversion. However, over shorter or longer time periods, mean reversion may tend to predominate. When designing momentum factors, I suggest you not take into account the most recent month. In other words, to measure twelve-month momentum, use the price a month ago divided by the price thirteen months ago. This allows you to buy on the dip, especially if used in conjunction with value or mean-reversion factors. Some people believe that momentum can predominate over short time periods. These people are called trend-followers, and they design complicated factors that take advantage of this belief. I am not one of them, and I do not recommend factors such as those.
- Post-Earnings Announcement Drift. It has been observed that a significant relative price movement following an earnings announcement will result in a continuation of that movement rather than a regression to the mean. This is due to the infrequency of rebalancing by some money managers. If a money manager only rebalances monthly or quarterly, it will take some time for the good or bad information imparted by the earnings announcement to affect her portfolio.
- Volume-based technical factors. I’ve noticed that a large increase in volume tends to result in a subsequent increase in the price, whether that increase in volume is coincident with a price increase or a price decrease. The mechanics of how this works are unclear to me, but the phenomenon seems real. Warning: this phenomenon may be limited to microcaps and small caps. You may find other volume-based technical factors as well.
- Volatility-based technical factors. I’ll discuss these in the next section.
Stability Factors
Stability factors are concerned with avoiding extreme changes and large variations. They fall into two categories: fundamental and technical stability.
There are lots of ways to get at the stability of fundamental factors:
- Take the standard deviation of a measure (sales, for example, or accounts receivable, or gross margin) over a period of quarters or years and divide that by its average.
- Add up the absolute differences between consecutive quarters and divide that by the average or the total.
- Find the median change in a value over a certain period in the company’s industry or sector and compare the company’s change to that one, with the closer the result the better.
Technical stability factors fall roughly into four categories:
- Price volatility. Stocks with low price volatility tend to perform better than stocks with high price volatility. The easiest way to measure price volatility is to take the percentage deviation of the prices over a certain period.
- Volume volatility. This is the same as above, except using volume instead of price.
- Beta. Beta measures how closely a stock tracks the market. A beta of 1 means that every time the market goes up or down X percent, the stock goes up or down X percent too. A beta of 0.5 means that the stock goes up or down only X/2 percent, and a beta of 2 means that the stock goes up or down 2X percent. In general, beta has a negative correlation with performance, so low-beta stocks tend to outperform.
- Share turnover. This is the number of shares traded over a certain period divided by the number of shares outstanding. High share-turnover stocks will naturally have a higher beta than low share-turnover stocks, since more shares are traded around market-impact events. Therefore, low-share turnover stocks tend to outperform stocks with high share turnover. Share turnover is a more reliable and forward-looking measure than beta, because share turnover depends on recent data while beta needs to be examined over years, is difficult to calculate with precision, and can vary widely from one time period to another.
Size Factors
Despite the fact that researchers have found a “small-cap premium,” I maintain that size factors don’t work on their own. The small-size factor should only be used to enhance the effectiveness of other factors, and only if you can stomach the increased volatility and trading costs.
There are many ways to measure company size: market cap, daily dollar volume, assets, employees, more complicated liquidity measures, and so on.
Industry Factors
In addition to judging individual stocks, most of the above factors can also be applied to sectors, industry groups, industries, or subindustries. For example, you might want to invest primarily in industries with strong momentum, low share turnover, high growth potential, and so on.
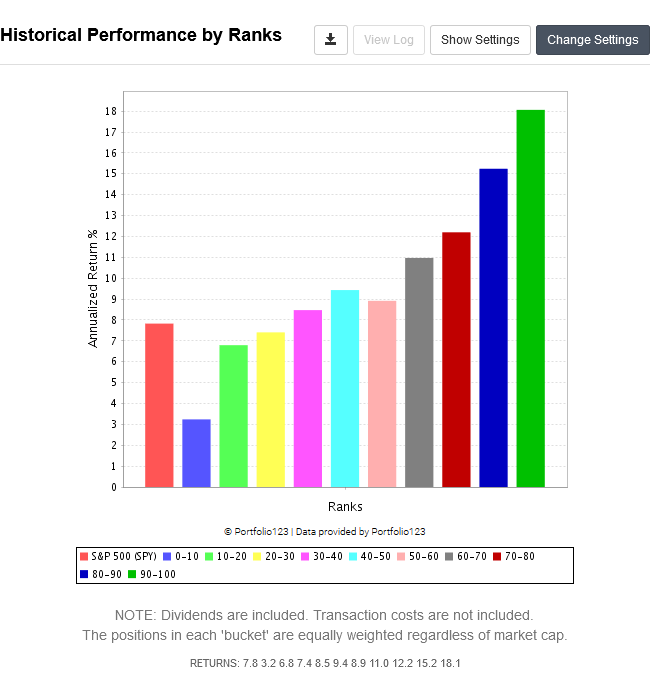
Assessing Factor Performance: “Bucket” Performance.
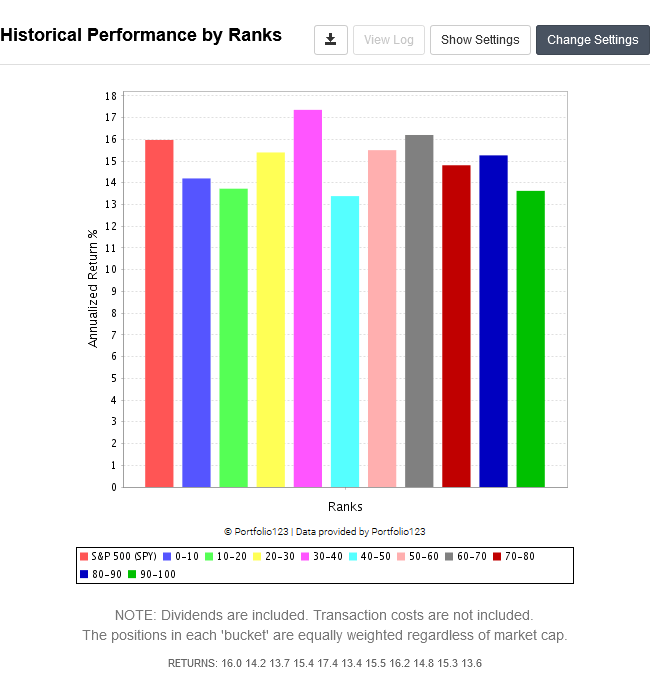
Perhaps the most common method of assessing how well a factor works is to use a “bucket” performance backtest. You divide your universe of stocks into quantiles (quintiles, deciles, ventiles, etc.) depending on how they rank on a specific factor. You then average the performance of each quantile, with a certain rebalance frequency, over a long period of time. You end up with annual returns for each quantile, and a chart that looks like this, if you’re lucky:
and like this, if you’re not:
Some tips:
- Always check the performance over the last ten years and the last twenty. If a factor works over one of these periods and not the other, it warrants some suspicion.
- If your rebalance frequency is longer than monthly, vary the starting dates.
- Never test your factor on a universe that includes uninvestable stocks.
- If your factor excludes certain stocks or has a lot of N/A values (for example, if you’re using research and development expenses, which most companies don’t report), test your factor on a universe that excludes those stocks.
- Don’t use more than twenty “buckets” (quantiles).
- If you set a limit on your results after ranking, you might end up with empty buckets. Always limit your universe before ranking if possible.
- Buckets do not have to have a perfect slope. As long as your top few buckets are, in general, outperforming the rest, that might be good enough.
- Some factors are mitigating or enhancing factors, and bucket tests may not work for them. For example, a bucket test of an accruals ratio probably won’t look too good, but considering accruals is important in order to mitigate earnings manipulation. The same thing may be true for a factor that looks at how late a company is in reporting its financials. Enhancing factors—particularly size factors—won’t show much bucket performance, if any. So combine factors like these with related factors that work and see if they enhance your results.
Assessing Factor Performance: Other Methods
- Equity curves. You might want to simply look at how the top 5%, 10%, or 20% of stocks would have performed over time, compared to a benchmark. That way you can see the periods in which the factor worked well and the periods in which it didn’t. You can then calculate more complicated performance measures like alpha and the Sharpe ratio.
- Long/short performance. Especially popular among academics, this test goes long the top quantile and short the bottom quantile. Now you’re hedging.
- Rolling backtests. If you want to test a factor’s performance over long holding periods, you can use a rolling backtest to look at the top quantile’s performance. For example, you could test buying the top 10% of stocks according to the factor every week and holding them for one year. You could then compare those results with buying the entire universe of stocks under consideration, and even map during which periods the factor outperformed or underperformed.
Conclusion
In designing a quantitative fundamentals-based strategy, good and comprehensive factor design is essential. Without it, your strategy will be middling at best.
In subsequent articles in this series, I will be discussing
- designing stock universes, ranking systems, and simulations;
- principles of backtesting; and
- strategy implementation.