

How to Be a Great Investor, Part Five: Think Probabilistically
This article is the fifth in a ten-part series loosely based on Michael J. Mauboussin’s white paper “Thirty Years: Reflections on the Ten Attributes of Great Investors.” See “Part One: Be Numerate,” “Part Two: Understand Value,” “Part Three: Properly Assess Strategy,” and “Part Four: Compare Effectively” for previous installments. And please keep in mind that although I’m basing my work on Mauboussin’s, I am departing from his ideas on occasion.
Thinking Probabilistically
Whenever you come up with a new investment idea—whether it’s a new security to buy, a new factor to consider, or a new strategy to implement—you naturally ask yourself whether this new idea will increase your portfolio returns or cause you to lose money (and, of course, how much). Thinking probabilistically involves assessing the probabilities and coming up with a reasoned answer. In this article I’ll tackle strategies and factors first before dealing with individual securities.
Assessing the Odds of a New Factor or Strategy
If you’re assessing the new factor or strategy on the basis of past performance, this involves three steps: assessing how well it would have worked in the past; assessing how correlative past results are to future (out-of-sample) results in general; and assessing whether the new factor or strategy will have better odds than the factor or strategy it is replacing (assuming you have to take the money from one in order to implement another).
If, on the other hand, you think that past performance is irrelevant to assessing future success, or that the correlation between past performance and future performance is unknowable, negative, or minimal, then you have to come up with another way of assessing future performance. But even in this case, you should also factor in your estimate of the correlation between your ideas and their future performance.
So let’s take a concrete example. Let’s say I want to replace a microcap-only strategy with a similar strategy that invests in stocks of all sizes, and that I believe that backtesting its past performance will give me some relevant results.
The first step is to test using robust methods. Test both systems on subsets of the universes you’re going to be investing in, and on subsets of the time period you’re backtesting. Try to make the tests as similar as possible to each other.
So, for this example, I’m going to backtest my strategies using Portfolio123. I’m going to make the two strategies as similar to each other as possible except that one will emphasize microcaps and the other won’t. In addition, I’ll program my slippage costs for the microcap model to be more than double my costs for the other.
It turns out that in 14 out of 16 tests, my new strategy (all caps) gives worse results than my old one (microcaps). That gives me only a 12.5% chance that my new strategy is an improvement.
Now I estimate that the correlation between past performance and out-of-sample performance of stock strategies is around 0.2 (using Kendall’s tau; 0.3 using Pearson’s r). To get at that number I took fifty strategies that I had not backtested that were loosely based on screening rules that were written by others. I did so in order to minimize the chance of using factors that I had already developed or tested, since those might contaminate the experiment. I tested and compared these strategies’ performance over various time periods.
This 0.2 correlation translates to a 40% chance that the past relative performance of any two strategies will reverse. (Here’s the math, if you’re interested; if not skip to the next paragraph. Kendall’s tau is calculated by looking at every possible pair in the two series and classifying them as concordant or discordant, depending on whether they’re in the same order or not. You then take the number of concordant pairs, subtract the number of discordant pairs, and divide by the total number of pairs. For example, let’s calculate the correlation between 1 2 3 4 5 and 1 3 5 2 4. Each series has ten pairs. 1 2 is concordant, 1 3 is concordant, 1 4 is concordant, 1 5 is concordant, 2 3 is discordant, 2 4 is concordant, 2 5 is discordant, 3 4 is concordant, 3 5 is concordant, and 4 5 is discordant. The correlation is thus (7 – 3)/10 = 0.4, and the chance that the relative position of a pair will reverse—a discordant pair, in other words—is three out of ten, or 30%. If the correlation had been 0.2, that would have been the result of (6 – 4)/10, and the chance of a discordant pair would be 40%.)
To calculate the chance of an event occurring with a certain level of confidence (or a certain correlation), you multiply the chance that the event will occur by the chance that you’re right, multiply the chance that it won’t occur by the chance that you’re wrong, and add them up. (The weird corollary is that if you’re right precisely half the time—a correlation or confidence level of zero—the probability of an event occurring will always be 50%, no matter how likely or unlikely it is.)
The probability that my new system will work better than my old one, then, is actually 42.5%. (The formula is 12.5%*60%+87.5%*40%.) This is still not high enough to bank on . . .
Now let’s say you consider past performance a completely unreliable measure of the success of a strategy. And let’s say you think your new strategy has a 70% chance of performing better than your old strategy. Well, the other number to take into account is the correlation between your predictions and what actually happens in the future.
In other words, how good a strategy designer are you? Let’s say you design ten strategies, and you judge one of those to be better than another. What is the chance that if you invest in both those strategies you’ll be right? Try to be as objective as you can here.
So let’s say that you think that this chance is about 60% (again, this represents a correlation of 0.2). Do the math again (70%*60%+30%*40%). It turns out you have a 54% chance of outperforming, not a 70% chance. So you might want to balance your investment between the two strategies, or combine them into one somehow.
So far, we’ve been discussing new strategies; but we can apply the same line of thinking to new factors. With factors, we have additional tools at our disposal because we can combine them using ranking and weighting. (We can combine strategies too, of course, but it’s not as easy to do.)
There are lots of ways to assess the effectiveness of a factor. The most traditional is to rank stocks in terms of the factor and see how well each quantile performed in the past. Many scholars simulate shorting the bottom quintile or decile and going long the top quintile or decile, but with some factors the middle quantiles may have performed the best.
Let’s look, once again, at a concrete example. I have a four-factor ranking system and I’m considering adding a fifth factor to it. The decile returns for my four-factor system over the universe of stocks that I invest in, with a one-month holding period, over the last ten years, looks like this:
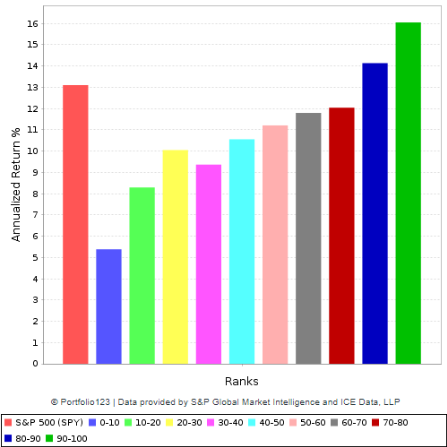
If I add my new factor, I get a chart like this:

Clearly, the second system, with five factors, works better than the first.
But if you look at probability, there’s a problem with this way of thinking. You could keep adding factors and varying their weights ad infinitum until you had a system that was perfectly optimized according to the tests that you run on it. Your system will look something like this:

Or, taking a more granular view with thirty quantiles rather than ten:

Your system will be optimized precisely for the time period that you are testing it for.
What is the probability that a system optimized for a specific period of time will outperform a non-optimized system in a different time period?
I’m not sure. But I want to offer an analogy.
Let’s say you’re designing a robot to play poker. In order to do so, you want the robot to play against real poker players so that it can learn from practicing the game. So you collect the five best poker players in your hometown and the robot plays poker with them. It soon gets so good that it can beat them at any game anytime. Now what would happen if you sat it down with five different poker players? It would probably fail miserably. Why? Because it would have learned how to beat the first five players based on their reactions to the cards and to each other, on their tells and on their strategies. On the other hand, if you had simply taught the robot the rules of playing poker and had fed it a variety of different examples and made it think about things more abstractly, it probably wouldn’t have won nearly as handily against the first five players, but would probably have performed better against the second five.
The analogy is imperfect, I admit. Poker doesn’t change as much as the stock market. A stock-market strategy or factor that worked really well in the 1960s may not have as much relevance in the 2020s as one that worked well in the 2010s.
At any rate, I recently ran an experiment. Remember those fifty strategies I told you about earlier? I took the ones that had performed best over a certain time period and tested them over a subsequent time period. Some of them did well, others did not. When I combined the ones that had done best in the first period into one comprehensive system, it did quite well in the second—better than most of those that had performed best in the first. When I optimized the one that had done best in the first period, fiddling with the factor weights until its performance was greatly improved, it didn’t do as well as the combined system in the second period. When I optimized the combined system to improve its performance in the first period, its performance in the second period got worse. Now this is a very small and limited experiment, and my results are hardly representative. It would take me many months to optimize dozens of systems over different time periods and test them all. But this does indicate that optimization may not be the best idea.
The other reason to be wary of optimization is the fact that with low correlations, what outperforms in one period is likely to suffer from mean regression and underperform in another period. In my previous article, “How to Bet,” I published the following correlation table.

Let’s say seven players play a tournament and player 1 wins, player 2 comes in second, and so on. The top row lists Kendall’s correlation; the other rows list the chance of each player winning in a second tournament. (I created the table by taking every possible order of seven players and grouping them according to their correlation with the first order.) You’ll see that with a correlation of 0.333 or higher, the top player has the best chance of winning; with a correlation of 0.238, the top two players have an equal chance of winning; with a correlation of 0.143, the top player has a lower chance of winning than the second- and third-place winners; and with a correlation of 0.048, the top player has an equal chance of winning as the sixth player, with the second, third, fourth, and fifth all having a better chance. This is due to the fact that absent a perfect correlation, there will always be some element of mean regression.
Assessing the Odds of a Security’s Future Price Increase
Let me start out by saying forthrightly that I believe that there is no way to do this. If there were, stock picking would be simple and profitable. And it’s definitely not. Instead, your best bet is to think about your strategy’s odds rather than the odds of an individual stock or ETF.
Mauboussin has a few pointed words about this. “When probability plays a large role in outcomes, it makes sense to focus on the process of making decisions rather than the outcome alone. The reason is that a particular outcome may not be indicative of the quality of the decision. Good decisions sometimes result in bad outcomes and bad decisions lead to good outcomes. Over the long haul, however, good decisions portend favorable outcomes even if you will be wrong from time to time. . . . Learning to focus on process and accept the periodic and inevitable bad outcomes is crucial.”
Allow me to add a few words about stock-return odds in general.
I recently took tens of thousands of random samples of 1-year returns of stocks over the last twenty years (with a minimum market cap of $50 million and a minimum price of $1.00, and with no survivor bias). For such stocks, here are the decile median returns:

In other words, a randomly chosen stock out of this group will have a ten percent chance of a 93% gain, a ten percent chance of a 78% loss, and a ten percent chance of each of the other numbers in-between.
Here is a graph of the returns distribution (the rightmost bar represents stocks with a return greater than 250%).

The median stock gets a 5.35% return and the average stock gets an 8.12% return. If you were to randomly choose twenty stocks a year and then do so again and again thousands of times, your compounded annualized return would likely be between 3.9% and 8.7%. On the other hand, if you were to randomly choose just one stock a year and then do so again and again thousands of times, your compounded annualized return would likely be a 100% loss, because at some point you’re going to choose a stock that goes bankrupt. (This is the key to understanding why some small amount of diversification is essential: you need to minimize the probability of losing all your money. Because of this risk, I would advise you to never put all your money into fewer than four stocks.)
The best you can hope for when you choose a stock is a returns distribution that is somewhat better than that of the average stock. Some writers, when they talk about choosing stocks, discuss “expected return.” But doing so without considering the entirety of the returns distribution can lead to gross errors such as the one Harry Markowitz made at the outset of his seminal 1952 paper “Portfolio Selection,” the foundation of Modern Portfolio Theory, in which he incorrectly “proved” that to maximize the expected return of a portfolio you should put all your money into the one security with the highest expected return. Markowitz ignored the laws of probability, as does MPT in general.
But that will be the subject of a future article . . .
THIS IS A PASTE-IN OF THE COMMENT I POSTED TO THIS ARTICLE ON SEEKING ALPHA
“If, on the other hand, you think that past performance is irrelevant to assessing future success, or that the correlation between past performance and future performance is unknowable, negative, or minimal . . . ”
Every reputable investor KNOWS that! By now, the only ones who dare to even suggest otherwise are the curve fitters, data miners, etc. . . . or worse; a professional investor who thinks this way will soon become a former professional investor and even a non-professional who advocates for the idea that past performance is indicative of future performance dances on the edge of securities fraud if said advocate foresees someone else will reasonably rely on such representations and doers so to their financial detriment. But you get lucky here. No would-be plaintiff could ever prove that they were REASONABLE in having relied on your suggestion because a mountain of evidence to the effect that such reliance can never pass the test of reasonableness would result in dismissal of any such complaint. So essentially, it’s legally OK for you to publish this because legally speaking, anybody who takes it seriously would be brushed aside as being unreasonable.
” . . .then you have to come up with another way of assessing future performance.”
And every reputable investor DOES that, and knows full well that it isn’t going to be done just by reading math/statistics books. You see countless examples on Seeking Alpha every day; every hour. Also, there are countless books on the topic. My favorites are “The Warren Buffett Way” and “One Up On Wall Street” but those are just a drop in the bucket considering how many others there are. You even recently reviewed Charles Lee’s “Alphanomics” book; I haven’t seen it but if it’s thrust is anything like the syllabus Lee uses to teach his Alphanmics class at Stanford, which I have, then that should be a terrific source.
“If you’re assessing the new factor or strategy on the basis of past performance, this involves three steps: assessing how well it would have worked in the past; assessing how correlative past results are to future (out-of-sample) results in general; and assessing whether the new factor or strategy will have better odds than the factor or strategy it is replacing (assuming you have to take the money from one in order to implement another).”
Even this is wrong. Unless you know WHY something did or didn’t do what it did or didn’t do in the past, you’re lost and relegated to hoping for dumb luck. Actually, the Mauboussin passage you misused has a lot to do with this. Ditto the O’Shaughnessy keynote speech at the recent AAII conference which you attended.
It’s about doing sensible things, not about crafting a series of pretty stair-step rank performance backtests pictures such as those presented here. Because with every rank performance test, you must understand WHY the market rewarded the factors emphasized during the sample period. If you don’t know WHY, you’re lost. And if you don’t know why, that leaves you vulnerable o what many others on Portfolio123 who produced backtests at least as pretty and in many cases better than those you’ve illustrated here . . . how well-tested models implode in the real world, sometimes immediately, and sometimes later, depending on when the market chooses to reward different things. If you know WHY, you’re equipped to deal with how things evolved. If you don’t know WHY but merely do math exercises, you’re at the mercy of Lady Luck.
“Some writers, when they talk about choosing stocks, discuss “expected return.” But doing so without considering the entirety of the returns distribution can lead to gross errors such as the one Harry Markowitz made at the outset of his seminal 1952 paper “Portfolio Selection,” the foundation of Modern Portfolio Theory, in which he incorrectly “proved” that to maximize the expected return of a portfolio you should put all your money into the one security with the highest expected return. Markowitz ignored the laws of probability, as does MPT in general.”
I know you love to denigrate the intelligence of Nobel Prize winners and it’s OK to do that, if you make a proper argument. I’m well aware of the shortcomings of Markowitz (as, by now, is the entire quant investment community as demonstrated by his algorithm having been enhanced/supplanted by things like Black Litterman) and even made it the basis for my MBA thesis back when Jimmy Carter was still President. The problem is not that Markowitz know less about probabilities than you do. He took statistics in school and presumably passed his exams. The “problem” is that his algorithm places an impossibly inhuman forecasting burden on those who would use his model (actually, the inadequacy of history and probabilities was part of my Thesis).
I’m not a believer in trying to forecast expected returns and expected variances/covariances, but for those who would like to explore the topic in a proper manner, I suggest diffing into the work of Rob Arnott and his company, where they do a fabulous job of explaining their forecasts, so good, in fact, they make it easy for you to disagree with assumptions, substitute your own, and come up with your own set. You might also want to check the white papers posted by Betterment on their site. I’m not a fan of how they implement MPT, but I have to tip my hat to a well-explained process. (FWIW, you should put 100% of your assets into the one with the highest expected return if you are confident in your ability to forecast; that nobody in their right mind would do this is based on the understanding that forecasting is hard. If you know how to forecast, there’s no point in playing with probability math.)
Marc, these are excellent points indeed, and I really appreciate the time and effort you put into making them.
I agree with you 100% that you must understand WHY things work, and that no amount of probability calculation or correlation measurement or past-performance chasing will ever overcome an inability to do so.
As for Markowitz, I’ll cover that more comprehensively in a later article.
One of the main thrusts of my article is a probability-based argument AGAINST optimization based on past performance, and AGAINST the pretty stair-step backtest results I showcased. I hope you appreciated that. Perhaps that argument should have been more forcefully made.
I think where you and I differ the most is in our interpretation of James O’Shaughnessy’s work, which both you and I admire. Here’s what you, O’Shaughnessy, and I all agree on: past performance does not determine future outcome. Where we seem to differ is on whether past performance can give one clues as to future outcomes. I interpret O’Shaughnessy’s brilliant work in What Works on Wall Street, which is about 80% devoted to the statistics of past performance backtests, as evidence that O’Shaughnessy believes that it can.
Nothing in my article implied that past performance DETERMINES future outcomes. If I posit a weak correlation between past performance and future outcomes, that does not imply causation or determination, only a connection between the two. In my experience, milk that has passed its expiration date is likely to go sour within a week. If I predict that the next carton of milk I buy will go sour within a week of its expiration date, that is because I believe in a correlation between my past experience and future outcomes. It is not because I believe that the milk that went sour a year ago DETERMINES or INFLUENCES the condition of the milk that will go sour a week from now. And of course I can’t be sure that the milk will go sour within a week. There’s no causality, only correlation; no determination, only probability.
I probably should have made this clear at the outset of my article, and I thank you for prompting me to make it clear now.