

The Magic of Combination: How Mixing Strategies Can Improve Results
The Netflix Prize
The Netflix Prize was a competition begun in 2006 to predict user ratings for films. Competitors were given ratings scrubbed of information about the users, and were challenged to find, using machine-learning methods, an algorithm based only on the raw data.
Netflix provided each team with about a hundred million ratings that half a million users had given to eighteen thousand movies. Each rating was a set of four numbers: the user number, the movie number, the date of the rating, and the rating itself (one to five stars). This was the training data; there were out-of-sample groups of data that, if correctly predicted, would then determine the winner of the competition.
It took almost three years before two teams passed the threshold Netflix had set for winning the competition. And the secret to their success was their ability to combine a large number of poorly performing algorithms into one that really worked. As Wire magazine wrote at the time, “The secret sauce . . . was collaboration between diverse ideas. . . . The top two teams beat the challenge by combining teams and their algorithms into more complex algorithms incorporating everybody’s work. The more people joined, the more the resulting team’s score would increase.”
This was especially true near the end of the contest. At that point the teams incorporated insights that were marginal and produced poor results. They even incorporated the idea that people tended to rate movies slightly differently depending on what day of the week it was. To quote Wire again, “Taken on its own, the fact that a viewer rated a given movie on a Monday is a horrible indicator of what other movies they’ll want to rent. . . . But combined with hundreds of other algorithms from other minds, each weighted with precision, and combined and recombined, that otherwise inconsequential fact takes on huge importance.”
Application of the Netflix Prize to Investing
When we’re designing a stock-picking strategy, we’re trying to predict stock prices, just as the competitors for the Netflix prize were trying to predict movie ratings. We’re given limited information, but we can glean some principles about how stocks work from that information. And the best way to predict stock prices is to take into account as much information and as many insights about stock prices as possible. We need to study what factors move stock prices and, rather than relying on just one or two of those, combine as many as we can, especially if they’re outliers.
I’m going to illustrate this with a concrete example.
Combining Stock Strategies
I’ve developed four very different stock strategies on Portfolio123. Each strategy is based on a ranking system with four equally weighted factors. Each strategy simply buys the top-ranked 25 companies out of the Russell 3000 (excluding REITs, MLPs, BDCs, and stocks with very low liquidity) every four weeks, rebalancing to equal weight.
Strategy #1 focuses on turnaround companies. It looks for underfollowed and undervalued companies with relatively low earnings that have nonetheless recently surprised analysts, who are now more bullish on them. Good examples of these companies right now are Parker Drilling (PKD), Information Services Group (III), Ambac Financial Group (AMBC), Eidos Therapeutics (EIDX), and BBX Capital (BBX), which are the five top-ranked stocks according to the four factors that I’ve chosen for this strategy. With 0.2% transaction costs, a backtest of this strategy returns a CAGR of 14.44% over the last ten years (compared to 13.19% for the Russell 3000), and 14.89% over the last twenty (compared to 6.23%).
Strategy #2 focuses on stocks whose dividends are growing; it also uses four factors. The top five companies in this strategy are Chemours (CC), Santander Consumer USA (SC), Zions Bancorporation (ZION), Hawaiian Holdings (HA), and Arch Coal (ARCH). This strategy also performs well on backtests, returning 14.91% per year over the last ten years and 13.81% over the last twenty.
Strategy #3 focuses on high-growth stocks with high R&D expenditures, primarily health-care and technology companies. The top five stocks here are Dell (DELL), Ribbon Communications (RBBN), ChannelAdvisor (ECOM), Checkpoint Therapeutics (CKPT), and Chimerix (CMRX). This strategy has stellar backtested returns: 25.41% over the last ten years and 22.44% over the last twenty.
Strategy #4 focuses on high-quality stocks—stocks with steady sales, low accruals, strong free cash flow, and excellent gross margins. It’s the only one of the four strategies that doesn’t take into account the stock’s price. The top five stocks here are Collegium Pharmaceutical (COLL), AbbVie (ABBV), National Research (NRC), Deluxe (DLX), and Verisign (VRSN). This strategy would have earned 14.26% over the last ten years and 12.84% over the last twenty.
Now the conventional thing to do is to put a quarter of your money into each strategy. You would have owned one hundred stocks at any one time, and if you didn’t move any of your money between the four strategies, your ten-year CAGR would have been 18.19% and your twenty-year CAGR would have been 16.60%.
But what would happen if you combined all four systems into one sixteen-factor system and just bought the top 25 stocks? You’d expect the returns to be similar to the returns of buying all four systems separately. Maybe they’d even be lower than that, since dividend-paying stocks and high-growth R&D companies don’t have a lot in common, and stocks with recent low earnings are usually not very high in the quality category.
Well, in fact, this system gets a backtested annualized return of 29.02% over the last ten years and 28.14% over the last twenty, which is significantly higher than any of the other strategies. And it invests in truly well-rounded companies. The top five now are AbbVie (ABBV), Information Services Group (III), ChannelAdvisor (ECOM), Merck (MRK), and Johnson & Johnson (JNJ).
Of course, what we’re looking for when we’re designing an investment strategy is not necessarily the one with the highest backtests, but the one with the greatest potential for future returns. Everything in my experience leads me to believe that combining strategies not only improves backtested results, but improves out-of-sample results too. It certainly worked that way for the competitors for the Netflix Prize.
How It Works
How does combining seemingly incompatible strategies into one big mess actually produce better results than keeping them separate? After all, this isn’t the strategy one would employ to produce good food, good music, good art, or good writing. Why does it produce good investing?
There are two reasons.
The first lies in the power of ranking. Unlike screening, ranking provides a great deal of flexibility. Let’s take a look at those top five stocks in the composite strategy, ABBV, III, ECOM, MRK, and JNJ. Of these, only ABBV has had strong dividend growth, while III and ECOM don’t pay dividends at all. III doesn’t report any R&D spending either. ABBV is clearly not an underfollowed turnaround stock—it fails miserably on three of the four factors in that system.
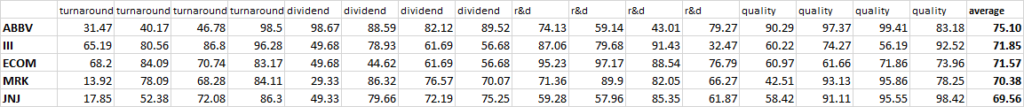
These are the rankings of each stock on the four factors I used in each system. (In my ranking system, a company that pays no dividend or is in an industry that reports no R&D expenses gets ranked in the middle, between 30 and 70, above companies with poor dividend growth or high payout ratios or low R&D-to-market-cap numbers.) You see, when you are ranking on sixteen different factors, a company can fail miserably on a few factors and still come out near the top if it scores well enough on the others. The average scores of these top five companies on these sixteen factors are not terribly high, in part because the factors vary so widely from each other. But the averages are higher than those of the other 2,600 stocks under consideration here.
The second reason that combining incompatible strategies produces good results is that the secret to getting high returns is to look at every stock from as many angles as possible. Buying a stock, as I’ve written many times, is like buying a used car. You want to look under the hood (or get a mechanic you trust to do so), get an expert opinion, take it for a test drive, read about the make and model, compare the price you’re getting to the listings of similar cars, and so on. Similarly, it pays to check every stock in terms of its value ratios, its quality ratios, its growth ratios, and its sentiment indicators. And employing combined ranking systems is perhaps the best way to do so.