

What Is a Company’s Intrinsic Value? (Pt 3)
This is the last part of my three-part article on intrinsic valuation. Here are Part 1 and Part 2.
Classification of Companies
Before we get into multi-stage analysis, let’s contrast young and mature companies. We shouldn’t look only at how many annual statements a company has filed to determine this; instead we should also use a company’s characteristics. There are plenty of companies that have reinvented themselves and gone from old age to infancy in terms of their growth rates.
So I’d like to propose five things that separate young from mature companies.
- A young company will likely not have a shareholder payout; a mature company will.
- A young company will have high sales growth; a mature company will have low sales growth.
- A young company may not yet have figured out how to transform revenue into earnings and cash flow; a mature company will have solid and stable earnings and cash flow.
- A young company may have accelerating growth; a mature company’s growth will be either decelerating or steady.
- And, of course, a young company will not have many annual statements in its history while a mature company will have a lot.
I came up with a rather complicated formula and a ranking system to classify companies as mature (top 50%), infant (bottom 25%), or in-between. But it turned out to be an idle exercise, not worth presenting in detail. Suffice it to say that for infant companies like Uber (UBER) and Peloton (PTON), I’ve concluded that the kind of present-value valuation I’m advocating in this article is nearly impossible, for reasons I’ll give shortly. For adolescent companies, a two-stage valuation will work, but is somewhat complicated. For mature companies, however, a very rough present-value calculation can be relatively simple.
Valuation of Mature Companies
For mature companies—companies with steady but low sales growth and consistent shareholder payout—intrinsic value is basically the expected shareholder payout divided by the difference between the discount rate and expected revenue growth. It’s therefore impossible to calculate for companies whose expected growth exceeds or comes close to the discount rate.
If we use 9.43% as our discount rate, a mature company with 0% expected revenue growth will be worth about 11 times its expected shareholder payout while a mature company with 8% expected revenue growth will be worth about 70 times its expected shareholder payout. This gets across pretty forcefully why you can’t value a company without taking its growth into account! It also explains why conventional measures like P/E and price-to-sales and price-to-book tell us very little when used on their own, without any consideration paid to growth potential.
Intrinsic Value Is a Very Rough Approximation
In Security Analysis, Benjamin Graham and David Dodd wrote,
“[The] concept of intrinsic value, as . . . definite and ascertainable, cannot be safely accepted as a general premise of security analysis. . . . The essential point is that security analysis does not seek to determine exactly what is the intrinsic value of a given security. It needs only to establish either that the value is adequate—e.g., to protect a bond or to justify a stock purchase—or else that the value is considerably higher or considerably lower than the market price.”
B. Graham and D. Dodd
Accordingly, I think it’s best to consider any company whose intrinsic value is between one-half and twice its market cap to be fairly priced. It’s those companies whose intrinsic value is greater than twice their market cap that you want to seriously consider investing in.
Valuation of Immature Companies
Immature companies often have little or negative shareholder payout, so there’s no dividend payment to put into the present-value equation. But we can’t simply substitute a percentage of revenue. Some companies have high revenue growth but poor prospects of actually converting that revenue into shareholder payout.
The essential thing to examine is a company’s margin and whether it is likely to increase. Margin is the percentage of revenue that remains after various costs have been deducted. Just as there are five components to predicting shareholder payout, I recommend looking at five margins: gross margin (gross profit to sales), operating margin (operating income to sales), net margin (net income to sales), cash flow margin (operating cash flow to sales), and shareholder margin (shareholder payout to sales). By looking at a company’s current margins and whether those are likely to increase or decrease over the years, and by projecting revenue growth, we can, through some relatively complicated mathematics, come up with the “dividends” needed for a two-stage analysis of an “adolescent” company.
As for those companies in “infancy”—companies with very few years under their belts, high sales growth rates, and negative projected shareholder yields—I would venture that trying to estimate their intrinsic value is a fool’s game.
An Example: Calculating the Intrinsic Value of NVR
NVR (NVR) has a projected revenue growth of 16.5%, making it impossible to value using the mature company approach. Its projected shareholder payout is $453 million.
Here’s my rough calculation of its intrinsic value.
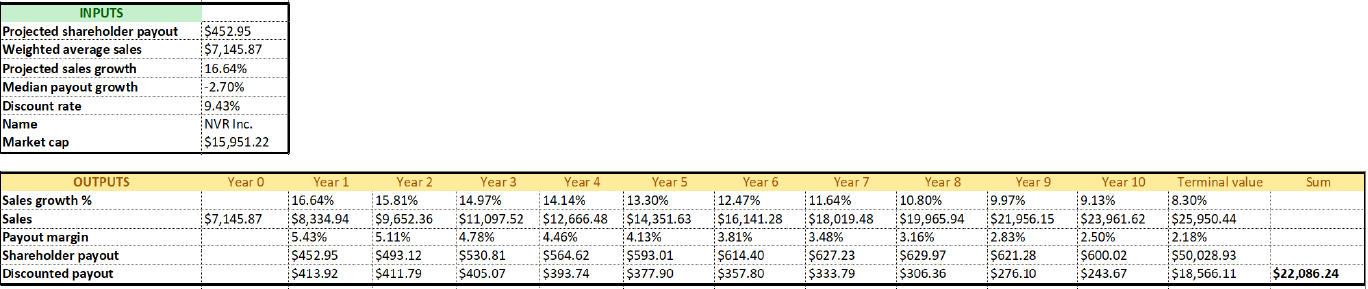
We require as inputs the projected shareholder payout, which I base on the company’s present shareholder payout, its net income, its EBIT, its cash flow, and its gross profit; its recent annual sales; its projected sales growth; its median payout margin growth over the last five years; and the standard discount rate.
The calculation proceeds as follows.
- The sales growth diminishes linearly from year to year down to a final value of 8.3%, which is a somewhat arbitrary number I use for high-growth companies.
- The sales increase by the sales growth.
- The payout margin starts at 5.43%, since that’s the projected shareholder payout divided by the year-one sales. It decreases from there to a final value of 2.18%, which is based on a formula that takes into account projected shareholder payout as well as the growth of shareholder payout over the last five years.
- The shareholder payout is the payout margin times the sales, so for year 1 it’s exactly the payout in the input.
- And then each year’s payout is discounted by 9.43%.
- For the terminal value, I took the eleventh year’s payout and divided by (9.43% – 8.3%) before applying the discount rate.
When I added up all the present values of the future dividends, I obtained an intrinsic value of $22 billion. That’s a little more than NVR’s current market cap of $16 billion. So I would conclude that NVR is fairly priced or slightly underpriced.
Now obviously it would be crazy to use this calculation for every company. Some companies have terrible margin growth but show signs of turning that around. For others you may want to put in different numbers for sales growth. If you were to do this kind of valuation for a company like Uber, you’d end up with a huge negative number, since its current margin is not only negative, but is getting more negative every year.
Approximating Intrinsic Value
In all, this formula includes the following measures. In calculating projected sales growth, we looked at 52-week relative price change, average recommendation, asset growth, average sales growth, the ratio of net operating assets to total assets, and analysts’ estimates of the next twelve months’ sales growth. In calculating our base for sales, we looked at the last three years’ sales. In calculating projected shareholder payout, we looked at equity purchased, equity issued, dividends paid, net income, operating income, operating cash flow, and gross profit. And in calculating margin growth, we looked at how shareholder payout has changed from year to year over the last five years. So our approximation of intrinsic value is a pretty holistic measure. It doesn’t take into account a lot of things—there’s no asset turnover, no consideration of debt, no return on equity or assets or capital, no free cash flow or capital expenditures, no enterprise value. All these factors are of great value, and if you’re serious about calculating intrinsic value, you’ll take them into account somehow. But for a very rough approximation that can be relatively easily automated, this is what I’ve come up with. I’m not claiming that it’s better than what others (e.g. Simply Wall St. or Aswath Damodaran) have come up with. But it suits my personal style. To be perfectly honest, I don’t think this measure is necessarily any better than a good, solid combination of relative value ratios. But maybe you can play around with it some and come up with something better.
I’ve made all my formulas public for Portfolio123 users who want to play with them. The later ones rely on the earlier ones, so you’ll have to copy all of them to get the rough intrinsic value formula to work. Some of them use a custom formula called $r, which is the discount rate you choose to use, expressed as a decimal (i.e. 0.094 rather than 9.4). Here are the links:
Projected sales growth; Projected shareholder payout; Terminal sales growth; Terminal value of a company’s sales; Terminal payout margin; Rough intrinsic value.
For non-Portfolio123 users, I’ve also created a Google sheet with all my formulas. You can see it here. I think the language in the P123 formulas is relatively easy to decode, but for more difficult items there’s a glossary there too.
Intrinsic Values of Large American Companies
Right now, according to my rough calculation of intrinsic value, the ten most valuable companies in the US are, in order, Apple (AAPL), Amazon (AMZN), Alphabet (GOOGL), Microsoft (MSFT), Facebook (FB), AbbVie (ABBV), Unitedhealth (UNH), Costco (COST), T-Mobile (TMUS), and Centene (CNC). In terms of value, the company that really sticks out from this list is Centene, whose market cap is far lower than those of the others.
Of the largest companies in the US by market cap, the ones that don’t make the list are also interesting. Berkshire Hathaway (BRK.B), which is the fifth largest, comes out 12th; Tesla (TSLA) comes out 17th, ahead of other US car companies, but behind Volkswagen (VWAGY) and Toyota (TM); Visa (V) comes out 58th because it’s really overvalued; Walmart (WMT) comes out 11th; and Johnson and Johnson (JNJ) comes out 20th. At the very bottom are the companies with the largest negative value: Uber (UBER), Peloton (PTON), and Zoom Video (ZM). All of these are clearly “infant” companies, which, as I’ve stated before, are not fit subjects for intrinsic valuation due to their enormous negative projected shareholder payouts and their history of decreasing margins.
The most underpriced companies in the S&P 500 are, according to my calculations, Centene, Amerisource Bergen (ABC), BorgWarner (BWA), ViacomCBS (VIAC), Best Buy (BBY), NRG Energy (NRG), McKesson (MCK), Humana (HUM), Cardinal Health (CAH), and L Brands (LB). But all of these companies require a far closer look than I’ve given them before determining whether they’re truly undervalued.
Performance of My Intrinsic Value Measure
Here’s a chart illustrating the performance of my intrinsic value method on the S&P 500 compared to some common relative value methods. These results were obtained by looking at the performance of all stocks with an intrinsic value greater than twice the company’s market cap (an average of about 25 to 30 stocks out of the 500) if one bought those stocks every week and held them for a year. I then compared that to buying about the same number of stocks per week by using relative valuation methods. Maybe intrinsic value is a little better than the relative value methods, but only barely. It’s hard to draw conclusions from numbers like these.

Here’s another chart, showing how this intrinsic value method compares to price to sales and EV to EBITDA over the last twenty years:

You’ll see that at the beginning of this century, EV/EBITDA was a great way to generate excess returns, and by now it’s really not; intrinsic value’s outperformance, though small, has remained pretty good throughout this entire time.
Please note that I did not backtest my system before coming up with it to see whether it would actually make a profit. My sole aim in designing the system was to see whether I could approximate a company’s worth without looking at its market cap. The fact that it works on S&P 500 stocks is a nice bonus, but I wouldn’t bet a dime that this particular automated system will continue to work.
As I said at the outset, doing intrinsic value by an automated method, which is what I’ve done here, is almost certainly not going to make you wealthy. But the fact that an automated system isn’t a complete failure gives me hope that applying the principles of Benjamin Graham and Warren Buffett properly—not by using relative value but by calculating intrinsic value, taking practically everything you can think of about a company into account—might end up working even in the twenty-first century.
Conclusions
I came away with my study of intrinsic value with the following conclusions.
- Intrinsic value calculation is, as everyone who has practiced it seriously has pointed out, far from exact. It is a kind of guessing game; it’s irrelevant for extremely high-growth and low-payout companies; and at best it can only give us a very rough idea of what a company is worth. However, it is not just an impractical fantastical game for nerds. The basis of intrinsic value calculation is logical, sound, and inescapable. A company has to be worth something besides what the market estimates it’s worth. And intrinsic value is the best guess we can possibly make.
- The four pillars of intrinsic value analysis are shareholder payout, revenue growth, payout margin (and its growth), and the discount rate. But practically everything else about a company should be taken into account when estimating these numbers. The discount rate, however, should probably be applied across the board equally to all companies, and should probably be in the range of 7% to 11%. Most importantly, risk measures should not affect the discount rate. High-beta companies do not deserve a higher discount rate than low-beta companies.
- Companies do go through stages: a stage of extremely high but steady growth, a stage of declining growth, and a stage of low but steady growth. Companies in the first stage are almost impossible to assign an intrinsic value to, but using a two-stage valuation process for the others can give you an approximation of what they might be worth.
- Estimating growth is of paramount importance to calculating value. A few percentages difference in growth has a larger effect on an intrinsic value calculation than almost anything else about a company. The growth/value dichotomy that so many people talk about is a false one when it comes to intrinsic value. That is because intrinsic value is concerned with the far distant future. So a company that is not growing is worth very little.
- Trying to come up with an automated way to calculate intrinsic value is probably not a great idea. There are simply too many factors to take into account. If you want to judge a company holistically in an automated (quantitative) fashion, I suggest using multifactor ranking systems instead. But if you don’t mind rolling up your sleeves and tweaking the numbers an intrinsic valuation system gives you, you might find some success.