

My Favorite Balance Sheet Ratio
Summary
- Offers a number of reasons to favor companies with low net operating assets (NOA).
- Examines NOA from eight different angles.
- Gives examples of companies with very low NOA.
(This article was first published on December 20, 2017; it has here been revised for Portfolio123’s blog.)
In this piece, I want to drill down deep into a ratio that I find useful in assessing potential investments: the ratio of net operating assets (NOA) to total assets (the lower, the better). It’s my favorite balance sheet ratio.
In a 2004 paper entitled “Do Investors Overvalue Firms with Bloated Balance Sheets,” David Hirshleifer, Kewei Hou, Siew Hong Teoh, and Yinglei Zhang came to the following conclusion: “In our 1964-2002 sample, net operating assets scaled by beginning total assets is a strong negative predictor of long-run stock returns. Predictability is robust with respect to an extensive set of controls and testing methods.” Their data seems convincing to me.
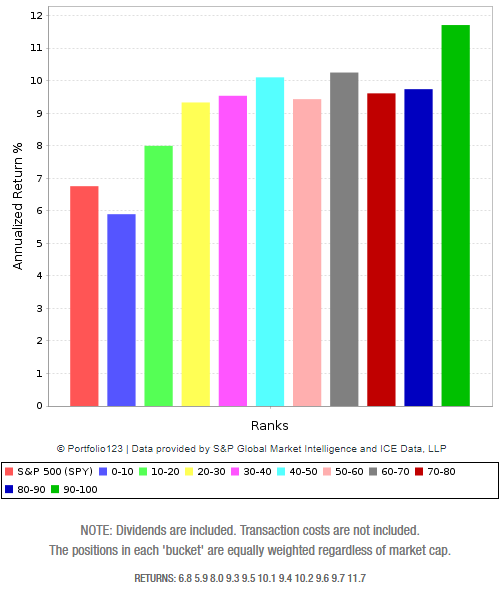
The ratio has produced similar results for the last 20 years too. I divided companies in the Russell 1000 into deciles depending on the ratio of NOA to total assets, with a monthly rebalance since January 1999, and looked at their price performance, using data available from Portfolio123. Here are the results, with the right-most decile having the lowest ratio. (The left-most bar is the return of the S&P 500.)
Hirshleifer et al. explain their conclusions by invoking investor behavior: “The financial position of a firm with high net operating assets superficially looks attractive, but is deteriorating, like an overripe fruit ready to drop from the tree.”
But there are other ways to explain this phenomenon. Like Wallace Stevens did in “Thirteen Ways of Looking at a Blackbird,” I’m going to look at eight different ways to define or calculate NOA.
1. This is the basic definition: subtract operating liabilities from operating assets, and you get NOA. Operating assets are the total assets minus cash and equivalents; operating liabilities are the total liabilities minus total debt.
Let’s look at an imaginary company that has 10 widgets in its inventory valued at $10 apiece, a factory valued at $100, $50 in cash, and $100 in debt. Its NOA, then, is $200 ($100 in inventory plus $100 in fixed assets), compared to $250 in total assets, for an NOA ratio of 0.8. Now let’s say it sells five of its widgets for $20 in cash apiece, and it creates five more widgets at $10 apiece, deferring the cost of doing so (on the balance sheet, it has $50 in payables). Its NOA is now $150, but it has $350 in total assets (including $150 in cash), for a ratio of 0.43. As you can see, as you do business wisely, you reduce your NOA.
Now, let’s look at another company that starts from an identical position but does business a bit differently. It sells its five widgets but doesn’t get paid up front (on the balance sheet, it now has $100 in receivables) and creates five more widgets using its cash reserve of $50. Both companies have a net income of $50, $200 in equity, and $100 in debt. But company B’s net operating assets will be $300, with an NOA ratio of 1.
Now, which company is in a better financial position? Company A has $150 in cash and company B has none. Company A can pay off its payables, pay down its debt, and/or invest in more widget production; company B can’t do anything until it gets paid, borrows more money, or issues more shares.
2. The current NOA is the NOA at the firm’s inception plus the accumulated balance-sheet accruals since then.
The CFA Institute defines accruals in two different ways, one based on the cash flow statement and the other based on the balance sheet. The balance sheet accruals number is simply the increase in NOA from one period to the next. It therefore follows that NOA is the sum of all the accruals over the history of the firm in addition to whatever operating assets the firm started with. A company with low accruals is going to have lower NOA than it used to, so a company with low or negative NOA is going to be one with historically low accruals.
3. NOA is the sum of all debt, all equity, and all non-controlling interest, minus cash and equivalents.
(If you’re a Portfolio123 user, this is one way you can calculate NOA: DbtTotQ + IsNA (NonControlIntQ, 0) + IsNA (PfdEquityQ, 0) + ComEqQ – IsNA (CashEquivQ, 0).)
What is the ideal way to finance the ongoing operations of your company? Clearly, the answer is with cash. Cash has no costs. Debt has interest costs and risk; equity dilutes the ownership of your company and has high costs due to investor expectations. Therefore, the more of your assets are in cash and equivalents and the less are in debt and equity, the lower your cost of continuing operations will be.
4. NOA can be calculated by subtracting cash, equivalents, and non-debt liabilities from total assets.
You can rank companies, as Hirshleifer et al. and I did above, on the ratio of net operating assets to total assets, with the lower values getting higher ranks. But you could alternatively rank companies on the ratio of cash and equivalents and non-debt liabilities to total assets, with higher values getting higher ranks, and come up with the exactly the same rankings.
I’ve just explained why a company with plenty of cash is primed to grow, but what about non-debt liabilities? These consist primarily of accounts payable, deferred liability charges, and minority interest; also included might be accrued expenses, deferred revenue, deferred taxes, and commercial paper. These liabilities are often investable in the short term, and they cost nothing. They’re very roughly equivalent to what Warren Buffett calls, in insurance companies, “float.” To quote from the Berkshire Hathaway (NYSE:BRK.A) Owner’s Manual,
Berkshire has access to two low-cost, non-perilous sources of leverage that allow us to safely own far more assets than our equity capital alone would permit: deferred taxes and ‘float,’ the funds of others that our insurance business holds because it receives premiums before needing to pay out losses. Better yet, this funding to date has been cost-free. Deferred tax liabilities bear no interest. Neither item, of course, is equity; these are real liabilities. But they are liabilities without covenants or due dates attached to them. In effect, they give us the benefit of debt – an ability to have more assets working for us – but saddle us with none of its drawbacks.
5. For a company with a price-to-book ratio of 1, NOA is exactly the same as enterprise value (EV). EV is defined as market capitalization plus preferred equity plus non-controlling interest minus cash and equivalents plus total debt; NOA can be defined in exactly the same way except by substituting book value, or common equity, for market cap.
In every EV-based valuation ratio – EV to EBITDA, EV to gross profit, EV to sales, or the classic of discounted cash flow analysis, unlevered free cash flow to EV – the lower the enterprise value, the better. So, it stands to reason that if a company’s price-to-book ratio is more or less 1, the lower the NOA, the better.
6. Since common equity is the sum of net operating and net financial assets, NOA is equivalent to common equity minus net financial assets. Financial assets (as opposed to operating assets) are cash and equivalents; financial liabilities are debt, preferred equity, and non-controlling interest; and net financial assets is the difference between them.
Of all a company’s sources of capital, common equity has the highest cost. So a company with a low ratio of common equity to net financial assets is probably going to be healthier than a company with a high ratio. Remember that in DuPont analysis, return on equity is profit margin times asset turnover times the ratio of assets to equity. Clearly, having a lot more assets than common equity is a good thing.
7. Today’s NOA is last year’s (or quarter’s or decade’s) NOA plus accumulated net operating profit after taxes (NOPAT) since then, minus accumulated free cash flow (defined as the sum of cash flow from operations and cash flow from investments – the latter is usually a negative number). Using the same logic as I used in definition 2, NOA is therefore the accumulated NOPAT since the company’s inception minus its accumulated free cash flow. These equivalences come from Stephen Penman’s book Financial Statement Analysis and Security Valuation; his accounting reformulations depart from GAAP in many instances, so if you stick to GAAP numbers, your calculation of NOA based on NOPAT and free cash flow will be a bit off. However, in 90% of the Russell 1000, the difference between this definition and the previous definitions is less than 10%.
This is the crux of Hirshleifer et al.’s argument:
“When cumulative net operating income (accounting value added) outstrips cumulative free cash flow (cash value added), subsequent earnings growth is weak. In this circumstance, we argue that investors with limited attention overvalue the firm, because naïve earnings-based valuation disregards the firm’s relative lack of success in generating cash flows in excess of investment needs.”
They put it another way too:
“Net operating assets are a cumulative measure of the discrepancy between accounting value added and cash value added – ‘balance sheet bloat.’ An accumulation of accounting earnings without a commensurate accumulation of free cash flows raises doubts about future profitability.”
Companies with higher NOA ratios tend to have higher earnings at the present time, simply because of their accumulated profit. But their growth potential is significantly lower than companies with low NOA ratios.
From this understanding Hirshleifer et al. derive an eighth equivalence:
8. NOA is the accumulated accruals since the company’s inception (as measured by the difference between NOPAT and cash flow from operations) plus the accumulated investment in operating assets (the negative cash flow from investments).
There’s nothing wrong with having deep investment in operating assets, but a company with a history of negative accruals is able to convert cash into earnings much faster than one with a history of positive accruals.
I’ll close by naming sixteen companies with market caps over $1 billion with very low or negative net operating assets (under 20% of total assets). These are all stable companies with signs of healthy growth and are, in my opinion, currently undervalued; they’re all pretty cash-rich too. They are: AmeriSource Bergen (ABC), Autodesk (ADSK), Bristol-Myers Squibb (BMY), Cornerstone OnDemand (CSOD), CommVault Systems (CVLT), NIC (EGOV), Fortinet (FTNT), Hailiang Education Group (HLG), Humana (HUM), Incyte (INCY), Kinaxis (KXSCF), Microsoft (MSFT), QAD (QADA), Qualys (QLYS), Sony (SNE), and Trend Micro (TMICY) .
Disclosure: I am long TMICY.
great stuff… thanks!