
How Far Back Should You Backtest?
When backtesting a portfolio strategy, you have to decide how far back to look. Should you use all available data, stretching back decades? Or should you just look at the last few years? There are arguments to be made for both options.
There are those who believe that factors are eternal and immutable, and that the farther back you go, the better. If some factors are currently out of favor, they’ll bounce back soon enough.
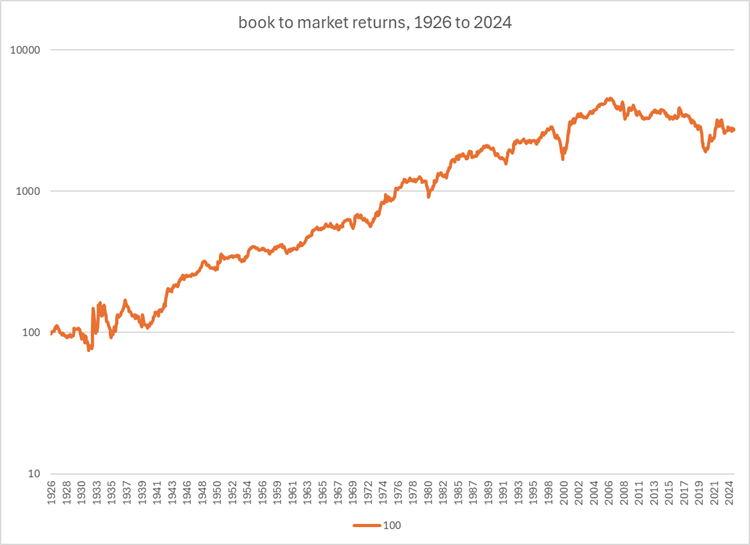
Others argue that the market has changed so fundamentally that old factors simply don’t apply. In addition, a lot of them have been arbitraged away. People point to the book-to-market factor as a good example: it worked well for decades, and then in 2006 it stopped working altogether. (The graph below charts the cumulative log returns of the upper half of the book-to-market spectrum minus the lower half from 1926 to 2024, assuming an initial investment of $100 and no transaction costs.)
For my entire investing career I’ve been in the latter camp. But something happened lately that caused me to change my mind.
Backtesting and Correlation
Do backtests have any correlation with out-of-sample results? If not, the whole idea of backtesting falls apart.
Let’s say an academic study finds that if you divided stocks into five groups according to how high their X ratio was, the highest group has a much higher Sharpe ratio than the lowest group. The study looks at US stocks over the last fifteen years. Would that be enough evidence to make you invest in stocks in that highest group?
It wouldn’t be enough evidence for me. I would want to know the answer to the following question: if I backtest fifty different strategies and take their Sharpe ratios over a fifteen-year period, would the results have a positive or negative relationship to the performance of those same strategies over the next five years? Perhaps the strategies would all mean revert, or perhaps having a high Sharpe ratio over a fifteen-year period signifies nothing.
In other words, backtests are only useful if their parameters are predictive. And that is something that these academic studies never really study.
So when I started using backtests to design investment strategies back in 2015, I decided to do some correlation studies. I had three major questions:
- Which performance measure is most predictive?
- Which lookback period is most predictive?
- How large a portfolio (or how many stocks out of the tested universe) is most predictive?
The work this took was enormous. First I had to design dozens of different strategies that were more or less untested; then I had to test them in various ways over various periods; and then I had to calculate the correlations between the backtests and a subsequent out-of-sample, untested period.
I was helped enormously in this endeavor by the tools available from Portfolio123, an invaluable source for factor research. And I came to the following conclusions, which I have affirmed by retesting many times:
- Trimmed alpha is the most predictive performance measure.
- A lookback period of nine to twelve years is optimal.
- A backtest that uses a lot more stocks than the final portfolio will hold is best.
The Problem of the Recent Past
As I’ve backtested and retested in order to design ranking systems, I’ve noticed over the years that the weight of value factors in my systems has kept dropping. And it was quite clear why. In general, value factors haven’t worked that well over the last twelve years compared to prior years.
But I have a strong gut feeling that there will be a resurgence (and perhaps there has been in the last few years). So I recently began to question my backtesting methodology.
Portfolio123’s data only goes back to 1999. Doing a twenty-year backtest and comparing the results with a three-year out-of-sample period with a one-year gap between them has only been possible since January 2023. And then you only have one or two out-of-sample periods to go on. Because of this limitation, I tested up to thirteen to fifteen years, never twenty or more. And there was always a drop-off after ten or twelve years. For example, I could set up a test that compared strategy returns through 2014 with an out-of-sample period spanning 2015 through 2017 inclusive, and test various starting dates for the backtested period. I could then move all the dates forward one year and end up with a somewhat wide variety of out-of-sample periods. When I averaged all the correlations over the various periods, it was quite clear that five-year periods were relatively useless and ten-year periods were pretty optimal.
But the out-of-sample periods were all in the last ten years. There were no out-of-sample periods covering the Great Financial Crisis or the Dot-Com Crash. I just didn’t have the data to go that far. (I did, at some point, use out-of-sample periods that were prior to the in-sample periods, but the results were more or less the same; and I’m not sure that this is really proper procedure.)
The Fama-French Solution
Then, a few weeks ago, I decided to backtest using the Fama-French library rather than Portfolio123. This library has returns for various strategies going back decades. At first, I ran the numbers on strategies going back to 1990 and tested up to fifteen years. This gave me a lot more to go on, and the results were very familiar: the performance dropped off after ten years. But then I decided to go farther. Most of the data in the library goes back to 1963. This gave me the ability to backtest far more than twenty years.
So I set up a rather huge test. I took 203 different series of returns from the library, all at one extreme or another. If, for example, the Fama French library tested 25 different combinations of two factors, size and profitability, I took the four most extreme: the quintile with the largest companies and the one with the highest profitability, the smallest and highest, the largest and lowest, and the smallest and lowest. I then measured the alpha of each strategy in the 3-year, 4-year, 5-year, and so on to 24-year periods ending in June 1987. I repeated that for 3-year to 24-year periods ending in December 1989, and so on every 18 months. Now I had tests covering 22 periods of various lengths ending on 22 different dates for 203 series of returns for a total of 98,252 different alphas.
I then calculated the total return of the same strategies for the three-year periods one year subsequent to the end of the alpha tests. Following that, I calculated the correlation between the ranks of the 203 strategies’ alphas during the backtest and the ranks of the subsequent out-of-sample total returns. And I then averaged those correlations over the 22 different out-of-sample periods.
The result confirmed what I’d been testing for the last eight years or so: if you’re choosing between a backtest period of three to fifteen years, a nine-to-twelve-year lookback is optimal.
But take a look at this chart (keep in mind that the out-of-sample tests begin a year after the backtests end, so the optimal lookback would be one year longer than the number of years tested).
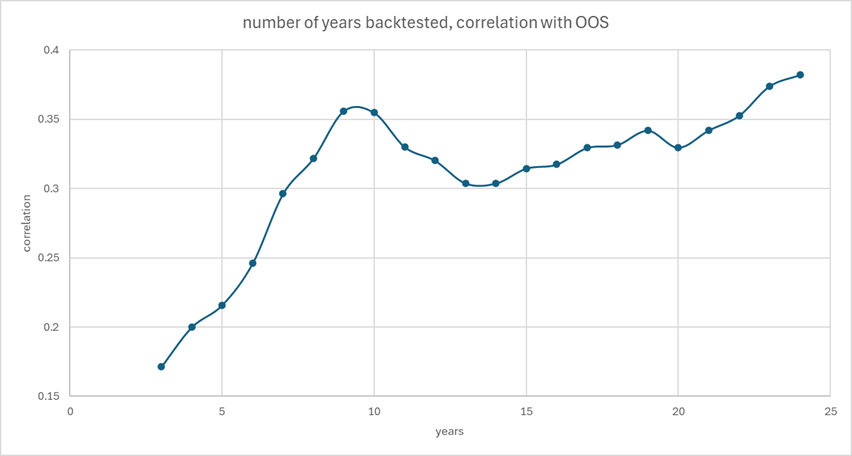
The lookback periods after fifteen years begin to show increasing correlation, until you reach 24 years, at which point the correlations exceed those of the nine-to-twelve-year lookback.
In the end, after a great deal of experimentation, I came to the conclusion that the best approach to a backtest is to use the trimmed alpha of the last ten years as well as the trimmed alpha of the last twenty-five or more, emphasizing the latter. This is a very commonsense solution, and perhaps one I might have arrived at without all the correlation studies.
Searching for an Explanation
How might one explain that the optimal lookbacks are 10 and 25 years? Is there something about market and factor cyclicality at work? Or something about the nature of factors?
The reason is actually rather interesting. Below are two charts. The first are the correlations for the first 11 of the 22 periods I tested; the second are for the last 11.
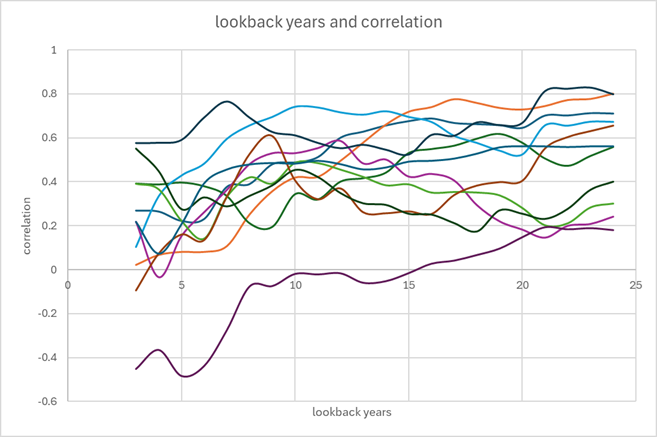
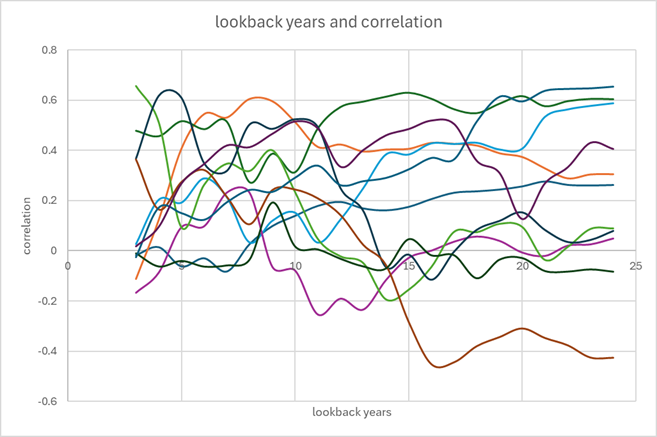
Basically, in the last sixteen years there were quite a few three-year out-of-sample periods that were very much out-of-sync with the previous twenty-five years and more in-sync with the recent past. But in the previous sixteen years, there were almost none.
Let’s break this down a little more. Here’s a chart showing the optimal lookback periods for the 22 different starting dates of the three-year out-of-sample periods.
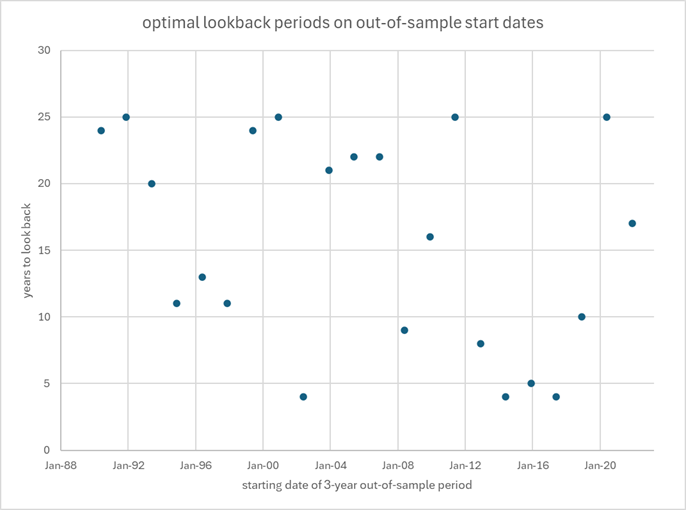
The biggest outliers here are the four three-year out-of-sample periods that began on June 2002, June 2014, December 2015, and June 2017. These all resembled the more recent past much more than they did the distant past. And those are the periods that really skewed the results. Close on their heels are three other periods: those that began in June 2008, December 2012, and December 2018. Notice that between 2012 and 2017 (the last of these ended in June 2020) we had five of these periods in a row. During that entire eight-year period, factors worked more in line with the last three to ten years than in line with the last twenty-five.
Why?
It could just be chance. I have observed a pretty good correlation between the optimal lookback period for a three-year out-of-sample period and the performance of value stocks during that period, as measured by high book-to-market stocks minus low book-to-market stocks. But that may be coincidental.
There’s another possibility, though. Between the Great Financial Crisis and the COVID crash there were relatively few retail investors actively participating in the US stock market. The GFC scared them away and most of them turned to 60/40 funds; if they invested in stocks, they did so passively, buying ETFs. Institutional investors dominated the market. By 2009 trades by retail investors made up less than 2% of trading volume, and by 2019 daily net flows from retail investors bottomed out at about $200M per day. Things changed dramatically with COVID. Suddenly a huge number of retail investors were actively stockpicking. By mid-2020 daily net flows had risen to $1B and by 2023 to $1.4B. By then, retail trades made up as much as a third of all trading in the US, beating out mutual funds and bank trading, and breaking even with hedge funds.
What does this have to do with factors? One could argue that retail investors are “dumb money” and that they’re more susceptible to behavioral fallacies than institutional investors are, and that therefore when retail investors participate heavily in the market, factor-based investing can rely more on the age-old tried and true factors rather than having to search for the new and different. Factors only work because of investor behavior; the more uninformed the average investor is, the better factors should work in the long run. (The exception might be during extended bubbles.)
What Factors Will Work Best in the Near Future?
We know from numerous studies that factors tend to be arbitraged away once discovered. We also know from numerous studies that factor classes tend to bounce back: if value has been in disfavor for a number of years, it will likely return; the same can be said of size, quality, growth, momentum, and so on. Lastly, we know that there are fundamental changes in the market, e.g. the speed of information dissemination, which quickens arbitrage and makes the discovery of new factors more imperative. All three of these forces tend to push and pull in different directions. The result might well be a complete absence of predictiveness when it comes to factors. People speak of factor momentum and factor reversion, but I have yet to be convinced of any predictability when it comes to what factors will work best in the near future.
Even if the years between the Great Financial Crisis and the COVID crisis were anomolous because of low retail participation, we shouldn’t discard them altogether. There are many valuable lessons to be learned from focusing on that period, which was a difficult one for factor-based investors.
Rather than guessing what factors will work best in the near future, I think it’s far better to concentrate on what factors work well in general. And that’s what the 10-year and 25-year combination tries to emphasize.
My conclusion goes strongly against the way machine-learning has been devised. There’s a strong resemblance between my studies and machine learning: one trains the model on X number of years, there’s a pause, and then there’s an out-of-sample (or holdout) period in which the model runs without further training. Normally the whole thing is then advanced a year or two. The model whose out-of-sample tests do best is the one you choose. But there’s a good deal of difference between my conclusions and machine learning. These models are not designed to take into account the entirety of past data. There is always a set limit, and that’s usually substantially less than the entirety. Machine-learning models trained on the last ten or twelve years of data will likely not favor deep value stocks. The idea behind sequential training periods disfavors the idea that out-of-favor factors can bounce back.
Before I conclude, one caveat to the backtest-as-far-back-as-you-can conclusion is in order. The farther you go back, the less data you have, and the less reliable that data can be. This isn’t necessarily true of fundamental data, but it is of analyst, institutional, insider, short interest, and similar kinds of data, especially outside North America. Even fundamental data has had some shifts due to changing IFRS and GAAP standards. The Fama-French data doesn’t have these limitations: the 25-year-and-more lookback is an idealized case. So when considering how far back to backtest, also take into account how far back you can reliably backtest.
