

Misbehaving Factors
The conventional method of finding out whether or not a factor works is to look at the performance of the top (or bottom) ten or twenty percent of stocks ranked according to that factor and then subtract the bottom (or top) ten or twenty percent. One should then buy stocks that rank highly on that factor and sell (or short) stocks that rank near the bottom.
But there are a lot of factors for which it makes more sense for middling values to be best. You have to think each factor through logically.
Change in profit margin (net income divided by revenue/sales) is one such factor. The companies whose margin has risen the most over the last year have decreasing sales and increasing income; companies whose margin has fallen the most have decreasing income and increasing sales. Neither of those is a good thing. If your income is increasing but your sales are falling, your income increase will be unsustainable and you’ll be setting yourself up for a fall (or maybe you’re cooking the books). If your sales are increasing but your income is falling, you’re likely using your revenue inefficiently.
Using the S&P 1500 and monthly rebalancing, I created, using Portfolio123, a decile-by-decile graph of how stocks have fared on this factor over the last twenty years:
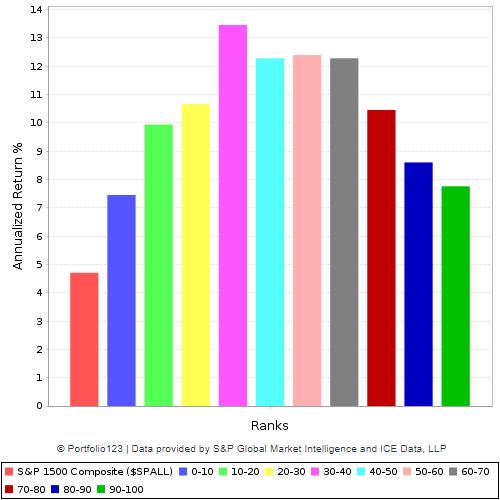
Sales growth is another such factor. Companies with unsustainable sales growth are usually punished by the market. Here’s a chart using the same parameters as the previous one, except looking at sales growth rather than margin growth. I bet you could look at a hundred years of data and see this play out well.

These are what I like to think of as “misbehaving factors.” They’re giving you the middle finger, challenging you to deal with them.
It’s absolutely vital to think every factor through. Ask yourself: Are stocks that have super high (or super low) factor X really more likely to outperform than stocks that have middling factor X? You’ll often find yourself answering: Well, not necessarily.
But what should we do with factors like this? Should we simply ignore them? Should we combine them with other factors to see if the pattern will change? Or should we favor middling values?
When I started evaluating stocks back in 2015, I decided to concentrate on factors that had the most impact, that made the most difference. Here was my thinking.
I wanted to evaluate every stock I bought from as many angles as possible. Obviously, I couldn’t hope to evaluate stocks on absolutely everything—there were certain factors I tried for which it made little sense to evaluate a stock. I wanted to look at the factors that showed the largest discrepancies between high and low forward performance, no matter where those discrepancies showed up on the chart—at one end or in the middle. And while it may be “data-mining” to estimate an optimal rank or value for a factor, that still may be more logical than settling on the highest/lowest value or ignoring the factor altogether.
So that’s what I did. I created ranking systems in which I favored low values for some factors, high values for others, and middling values for yet others. Since nobody else at the time was favoring middling values for anything, that gave me an edge. And I went on to triple my money in less than three years. Of course, there may be absolutely no relationship between using middling rankings and tripling my money. But both in backtests and out of sample, this technique seems to improve results.
Just because some factors “misbehave,” don’t count them out. If you want to really evaluate every stock you buy from every major angle, leaving out a factor with a large significance (a big difference between the highest and lowest decile performance) can have a worse effect on your returns than including a factor that, it turns out, doesn’t “work.” Feel free to leave out factors that honestly don’t make much difference. But if you see a factor with a huge variation in returns between deciles, you probably want to avoid stocks in the top and bottom deciles and favor stocks in the middle few. That will help make every stock you pick a real treasure.
Hi Yuval, Interesting blog. But how could it be used in ranking. Asc and desc are linear functions, but how can I use normal distribution in ranking? Of course I can use > or < than some rank, but that is not optimal.
Yours Ari
You have to choose an optimal high point. For example, you could choose 5% or 10%. Or you could choose the median, or the 70th percentile. You then rank on the absolute value of the difference between the optimal high point and the factor’s value, with lower being better.
So, for example, you could rank stocks on sales growth as follows: Abs(Sales%ChgTTM-5), with lower values being better. Or you could rank on the industry median: Abs(FRank(“Sales%ChgTTM”,#industry,#desc)-50). If you wanted to rank on the 70th percentile, you could put 70 instead of 50. You could also rank on the universe or the sector instead of the industry by using #all or #sector. In a screen, you can use #previous. There are a lot of possibilities to play with.
A third way to do this, and one that I’ve explored only a little, is to calculate an approximate formula for the distribution curve. Download the results from the distribution chart, put them into Excel, and get a polynomial estimate for the slope. Then plug in the FRank number for the x’s in the equation, and rank higher is better.
This is exactly why I added the “Learning to Love Mediocrity” pre-set screen a few months ago; to try to encourage p123 users to think along these lines (see the “About” text that accompanies that screen).
Ari, I suggest that you don’t twist yourself into a pretzel trying to use ranking for this. Use screening/buy rules; the easiest thing to do is use a conventional ranking system that picks from the top/bottom but apply it to a sub-universe that has been screened to eliminate extreme ranks, or FRanks (perhaps using z-scores). For those whose religious beliefs require require ranking only, use of booloean rank factors can help —but screening/buy rules let you do more).