

Does Joel Greenblatt’s “Magic Formula” Investing Still Work?
This article is the third in a series about screens designed by famous investors. The first, on Benjamin Graham, can be found here; the second, on William O’Neil, can be found here; and for an overview of the subject, see my article “Can Screening for Stocks Still Generate Alpha?“. Here are the rules for the Magic Formula screen I’m using for this article.
The Little Book that Beats the Market
In 2005, Joel Greenblatt published a book called The Little Book that Beats the Market. Its explicit aim was to “explain how to make money in terms that even my kids could understand (the ones already in sixth and eighth grades, anyway).” Although it used language and examples that were aimed at children, it was widely read by folks of all ages. The first five chapters, before Greenblatt gets into his investment strategy, comprise an excellent introduction to value investing. Clearly written, easy to understand, it’s principled and right.
The bulk of the very short book—you can read the whole thing in a few hours—consists of Greenblatt’s pitch of a very simple investment strategy that he called “magic formula investing.” The premise is simple. Take a bunch of stocks and rank them on quality; take the same bunch and rank them on value. Add the two ranks and buy the stocks with the highest summed ranks. Hold them for a year—or preferably longer.

For his quality factor, Greenblatt chose return on capital, defined as EBIT divided by the sum of working capital and fixed assets. For his value factor, Greenblatt chose EBIT divided by enterprise value.
The results were nothing short of spectacular. His rolling one-year backtests were beauties, with his strategy outperforming the market pretty consistently. But that was nothing compared to his bucket backtests, where he took a universe of 2,500 stocks and divided it into ten groups of 250 stocks by rank and showed their annual returns, which were step-by-step each worse than the one before. And that was nothing compared to his three-year backtest, where he took his top thirty out of 3,500 stocks and held them for three years. In that backtest, there wasn’t a single year in which his portfolio didn’t both beat the market and end up with positive returns.
And the formulas made a lot of financial sense too. They were common-sense formulas that were transparent and fair. There seemed to be nothing at all up Greenblatt’s sleeve—no complicated market-timing mechanisms, no opaque and complex accounting formulas. Just one numerator and two denominators, both easy to grasp and standard in the financial literature.
The book sold well enough that Greenblatt published a second edition in 2009, adding the word Still before Beats the Market, and adding a nice new afterword that updated his numbers.
And then Shazam! The magic formula stopped working.
The Magic Formula Screen and Its Performance
After a spectacular 2009 (in which the Greenblatt portfolios beat the market by an average of 50%), stocks bought in 2010 lagged the market by 3%, and stocks bought in 2011 lagged the market by 28%. They beat the market by 7% in 2012 and 11% in 2013, but lagged the market by 9% in 2014, 10% in 2015, 13% in both 2016 and 2017, and 21% in 2018. Lastly, stocks bought in 2019, in the first nine months of that year and held for one year, lagged the market by 23%. Ouch! If you’d bought the thirty highest-ranked stocks every week over the last ten years and held them for one year, you would have made an average of 2.20% per year, while if you’d bought the S&P 500 ETF SPY instead, you would have made an average of 13.02%.
(This paragraph has all the technical details so that you can investigate or reproduce my results. Skip it if you’re not interested. Here are the rules for the screen I’m using, which I created using Portfolio123—they’re straight out of Greenblatt’s book. Start by eliminating OTC stocks, financials, utilities, and stocks with incomplete statements. After doing this, take the top 3,500 stocks by market cap. Rank these stocks on two criteria. The first is return on capital, which is EBIT divided by the sum of net working capital and fixed assets, where fixed assets is defined as total assets minus intangible and current assets. The second is EBIT divided by enterprise value. For EBIT you use trailing twelve-month numbers, for assets and working capital you use the latest quarter’s values, and you use the latest price to compute enterprise value. You then add those two rank positions and choose the top thirty stocks. I simulated buying those top thirty stocks every week and holding for one year. The numbers I’ve given are the average of the 52 weekly one-year returns from picking stocks in that calendar year.)
I tested this with two- and three-year holding periods too. The results aren’t as abysmal, but you still don’t come close to beating the market. The performance of the three-year holding period turns especially horrible in recent years. If you had bought the Greenblatt portfolio in any week between 6/22/2016 and 9/12/2017 and held it for three years, you would have suffered a loss of anywhere between 4% and 44% of your portfolio, without a single gain, while if you’d invested in the Russell 3000 instead, you would have made between 1% and 52% over the same three-year period, without a single loss. The difference between the average Greenblatt portfolio and the market portfolio during those nine months’ worth of three-year returns is an astonishing 60% (you would have made an average of 39% holding the Russell 3000 and lost an average of 21% with the Greenblatt portfolio). Contrast that to Greenblatt’s boast of a three-year holding period never losing money and never failing to beat the market over the period he tested.
I also tested it on smaller universes, as Greenblatt did, restricting my choices to the largest 2,500 stocks and the largest 1,000. No matter what, the performance over the last ten years is miserable.
And remember Greenblatt’s ten buckets? Here are the last ten years’ worth of rolling one-year returns, based on a 2,500-stock universe:
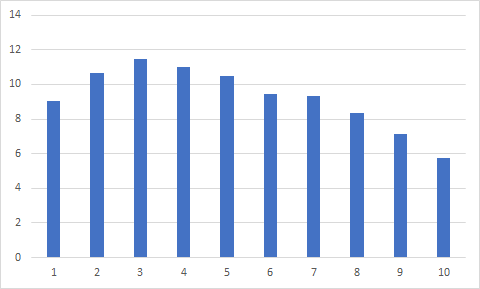
As you can see, the top bucket (#1, the most highly-ranked stocks) performs worse than any other bucket except for buckets #8, #9, and #10 (the worst stocks). (At least the slope is still in the right direction . . .) And if you had used twenty buckets, the top bucket would have done even worse.
There’s a blogger in Fort Worth who has chronicled his adventures using the magic formula. His latest post reads, “My MF Portfolio has lost thousands since early 2017, while the S&P 500 Index has risen nearly 35%.” I would like to extend him my sympathies.
Why Greenblatt’s Magic Formula Stopped Working
Why was Greenblatt’s system successful for so long, and why has it now failed spectacularly for ten years running?
First, the success. In my opinion, Greenblatt is right on the money about three basic principles:
- Buy good companies;
- Buy them at bargain prices;
- Use ranking to pick stocks.
This is advice I follow religiously, every day. Its past success is no accident.
As for its ten-year failure, one could come up with any number of explanations. The relative failure of value investing, broadly speaking, ever since the initial recovery from the Great Financial Crisis has been the subject of a lot of articles and editorials lately (including one I wrote), and any of those could apply to the magic formula, which is a particularly austere distillation of the principles of value investing.
But let’s stick with Greenblatt’s own words for a moment. First quote:
“Some companies deserve low prices because their future prospects are poor.”
Joel Greenblatt
(I used to be an editor, and I doubt that the redundant phrase “future prospects” would have evaded my red pencil.) Indeed. Greenblatt doesn’t consider growth at all, and the market has been especially good at predicting revenue growth lately: the correlation between price momentum and future revenue growth is astonishing. Many of the companies that pass the Greenblatt screen have low future sales growth. For example, if you had chosen the top 100 companies in September 2018, the median TTM sales growth of the surviving companies eighteen months later would have been –4.09%. But if you had chosen all 3,500 companies, regardless of their EBIT, their median TTM sales growth eighteen months later would have been 2.42%.
Second quote:
“If everyone used [the magic formula], it would probably stop working. So many people would be buying the shares of the bargain-priced stocks selected by the magic formula that the prices of those shares would be pushed higher almost immediately. In other words, if everyone used the formula, the bargains would disappear and the magic formula would be ruined!”
Joel Greenblatt
Indeed, the two factors that Greenblatt focused on basically stopped working while other less-focused-on measures of quality and value continued to provide investors with arbitrage opportunities. Just as the price-to-book value ratio stopped “working” shortly after Fama and French popularized its use in the 1990s, so too with EBIT to EV and its cousin EV to EBITDA ten or fifteen years later.
Third quote:
“So here’s the other thing you need to know about Mr. Market:
Joel Greenblatt
• Over the short term, Mr. Market acts like a wildly emotional guy who can buy or sell stocks at depressed or inflated prices.
• Over the long run, it’s a completely different story: Mr. Market gets it right.”
But as the financial commentator A. Gary Shilling likes to say, “The stock market can remain irrational a lot longer than you can remain solvent.” I really don’t have much faith that Mr. Market ever “gets it right.” Our job as investors is not to wait for Mr. Market to “get it right” but to find the stocks most likely to appreciate in value. These may well be, as Greenblatt would say, the stocks that Mr. Market has gotten the most wrong, but the best we can hope for is that at some point he’ll be somewhat less wrong.
Fourth quote:
“If you just stick to buying good companies (ones that have a high return on capital) and to buying those companies only at bargain prices (at prices that give you a high earnings yield), . . . you can achieve investment returns that beat the pants off even the best investment professionals (including the smartest professional I know). You can beat the returns of top-notch professors and outperform every academic study ever done. In fact, you can more than double the annual returns of the stock market averages!”
Joel Greenblatt
This is what I call magical thinking. Can you imagine those words coming from Benjamin Graham, Warren Buffet, or Charlie Munger? I can’t. If you’re looking for bargain prices, you need to look at a lot more things than earnings yield, and if you’re looking for good businesses, you need to look at a lot more things than high return on capital. You can’t judge a business as good or bad without looking at its stability, its growth prospects, and the quality of its earnings; and you can’t judge a business as a bargain without looking at a variety of valuation metrics. And you can’t forget that a lot of stocks will remain bargains—or overpriced—indefinitely. I mean, can you imagine Tesla, whose P/E is close to 1,000 right now, with a P/E of 10?
Last quote:
“The [magic] formula is simple, it makes perfect sense, and with it, you can beat the market, the professionals, and the academics by a wide margin. And you can do it with low risk. The formula has worked for many years and will continue to work even after everyone knows it.”
Joel Greenblatt
If anyone—I don’t care if he’s the pope or she’s the queen—tells you something like this, run! There’s no such thing as a magic formula because there’s no such thing as magic. Greenblatt’s entire book is a fairy tale.
Hocus Pocus
What is a “magic formula,” after all? It is a phrase like “abracadabra” or “bubble, bubble, toil and trouble,” a phrase that magicians and witches use to add a little effectiveness to their illusions. It goes with magic wands and magic potions and magic school buses. Remember that most of The Little Book that Beats the Market was originally written for children. It’s not about reality. It’s about magic. All those wonderful backtests? All the statistics that prove how beautifully it works? All the children’s stories and examples based on an imaginary chewing-gum business? These are the basic tools of the financial magician’s trade.
For those of us who live in the real world, it’s way past time to realize that a “magic formula” is inherently an illusion. It no longer works because it could never actually work. There will never be a simple, foolproof, and low-risk way to beat the market. That’s magic; that’s a fairy tale. Greenblatt should have known better.
Maybe someday I’ll write a book that can beat the market. After all, I’ve made more than a million bucks doing so. But that book won’t be “little” and it won’t have any “magic formulas” in it. My way of beating the market isn’t simple, isn’t foolproof, and isn’t low-risk. Beating the market requires not just a lot of extremely hard work, but a truly realistic mindset, with no room for magical thinking. The last thing an investor should ever want is a “magic formula.” It’ll always be an excellent recipe—for failure.
Good article. Its interesting that a company on the magic list two months ago just declared bankruptcy, Garrett Motion. For some real entertainment, watch the YouTube channels that are putting the MF to the test, with real money. They are not happy.
Excellent article. We had our kids read The Little Book four years ago when they were starting investing. It was, and is, important in explaining the basics. Now it’s time for them to read this blog. Ah, if only life were subject to magic formulae. Thank you for your insight. PS: I’ve also purchased Zora and Langston
Very interesting. I have been looking for a way to backtest this strategy so this is helpful. I am not familiar with Portfolio 123.
Question: When you say “I simulated buying those top thirty stocks every week and holding for one year.” Did you enter the market gradually, as he suggests, and then cap your stocks at 30?
No, I did not. I simply bought thirty stocks every week and held for a year. That way I got a good representative sampling of stocks.
O artigo em si está metodologicamente errado por uma base simples de:
Foi utilizado DCA (dollar Cost Average) ou seja, foi feito compras semanais da carteira, estilo buy and hold. Quando na verdade o proprio Joel e todos os artiggos cientificos ja publicados, deixa claro que esse método é por base do Lump-Sum, ou seja, se faz 1 unica compra de toda a carteira. Nao se faz compras recorrentes.
I used the lump-sum purchase with a one-year holding period in my article, but did it every week so that there would be 52 different results which I could average together.
Here is the result of a lump-sum purchase, rebalanced every 52-weeks, starting on January 1, 2010, using Compustat’s database: an annualized return of 7.51%; using FactSet’s database: an annualized return of 8.00%. That’s compared to the S&P’s 14.12%.
Here is the result starting July 1, 2010: Compustat: 4.35%; FactSet: 4.66%.
You can see that the choice of starting date makes a BIG difference! That’s why I did this lump-sum purchase with 52 different starting dates and averaged them all.
I’ve been reading “The little Book that Beats the Market” and got to page 90 and thought “Maybe I ought to just Google ‘Is Greenblatt’s Magic Formula still working?’” My key takeaway from your article is that one needs to be more sophisticated nowadays, and actually study all the metrics. Hard work and a Realistic Mindset, as you say. Thanks for the article 👏🏼